Gemini Summary

Signal Summary:

  • Configuration statement: Given a HY_OAS of 3.27, a CSC_z of 0.08, and accelerating 3-month momentum (1.27), this setup aligns with Range-biased price paths and Normal volatility, where the dominant risk is Mean reversion, not Regime shift (1).
  • The signal is currently in a NORMAL regime, reflecting credit conditions aligned with historical averages (1).
  • Conviction Band: Medium; Interpretation Confidence: High Confidence; Internal Conflict Flag: No. Signal Stability Assessment: Deteriorating; Threshold Proximity: Near; Revision Sensitivity: Unknown.

Methodology Applied:

  • A NORMAL regime is defined by High Yield (HY) spreads between 3.5% and 5% or a CSC z-score between -0.5 and 0.5 (1).
  • The TIGHTENING regime is triggered if HY spreads rise >50bps in 3 months or the CSC z-score reaches ≥0.5 (1).
  • Rising values imply a risk-off transition, tightening financial conditions, and an economic slowdown (1).
  • Credit Spreads Signal, latest observation: 2026-03-31 (1).

Key Dynamics:

  • The primary driver is the 3-month annualized momentum in HY spreads (z-score 1.27), indicating rapid widening from recent lows (1).
  • Momentum has shifted from negative in early 2025 to consistently positive over the last quarter (1).
  • Internal Tension: While HY spreads are widening, Investment Grade (IG) spreads remain more suppressed (z-score -0.55), suggesting stress is currently concentrated in lower-tier credit (1).
  • Conditional Invalidation: An HY spread increase exceeding 50bps over 3 months would force a transition to a Tightening regime (current 3m change is +46bps) (1).

Scenario Balance:

  • Base Case dominant: Continued range-bound Normal regime as spreads mean-revert toward historical averages.
  • Upside risk: Transition to EASY regime if HY spreads fall below 3.5% and CSC_z drops below -0.5.
  • Downside risk: Shift to TIGHTENING if current widening momentum persists, breaching the 50bps 3-month threshold.

Time Horizon & Aggregation:

  • Time Horizon: Cyclical (months); captures shifts in default expectations and liquidity premia.
  • Aggregation Weight Hint: Medium; provides a critical check on equity risk appetite and funding availability.

Macro Relevance:

  • This signal informs the US Credit Conditions macro dimension by measuring the cost of corporate borrowing relative to risk-free rates (1).
  • The economic mechanism is liquidity premia and default risk; rising spreads signal increased funding costs for cyclical firms (1).
  • Cycle position: Not determined.
  • Interaction: Typically confirms VIX movements; widening spreads with a calm VIX would signal credit-specific deterioration (1).

Regime Context:

  • The NORMAL regime has been persistent for five consecutive months following a brief EASY phase (1).
  • Direction of change: Strengthening/Deteriorating (spreads are moving from the bottom of the "Normal" range toward the "Tightening" threshold).

Model Limitations:

  • Suffers from a 1-2 business day reporting lag and frequent vendor revisions (1).
  • Bid-ask spread widening during market shocks can artificially inflate levels, creating microstructure noise (1).

Data & References:

  • ICE BofA US High Yield OAS and Corporate Master OAS as of 2026-03-31 (1).
  • HY_OAS (3.27) and hy_d3m_ann_z (1.27) are the most influential current datapoints (1).
  • The VIX and Federal Reserve Liquidity proxies would improve reliability (1).

Credit Spreads Chart

Signal chart

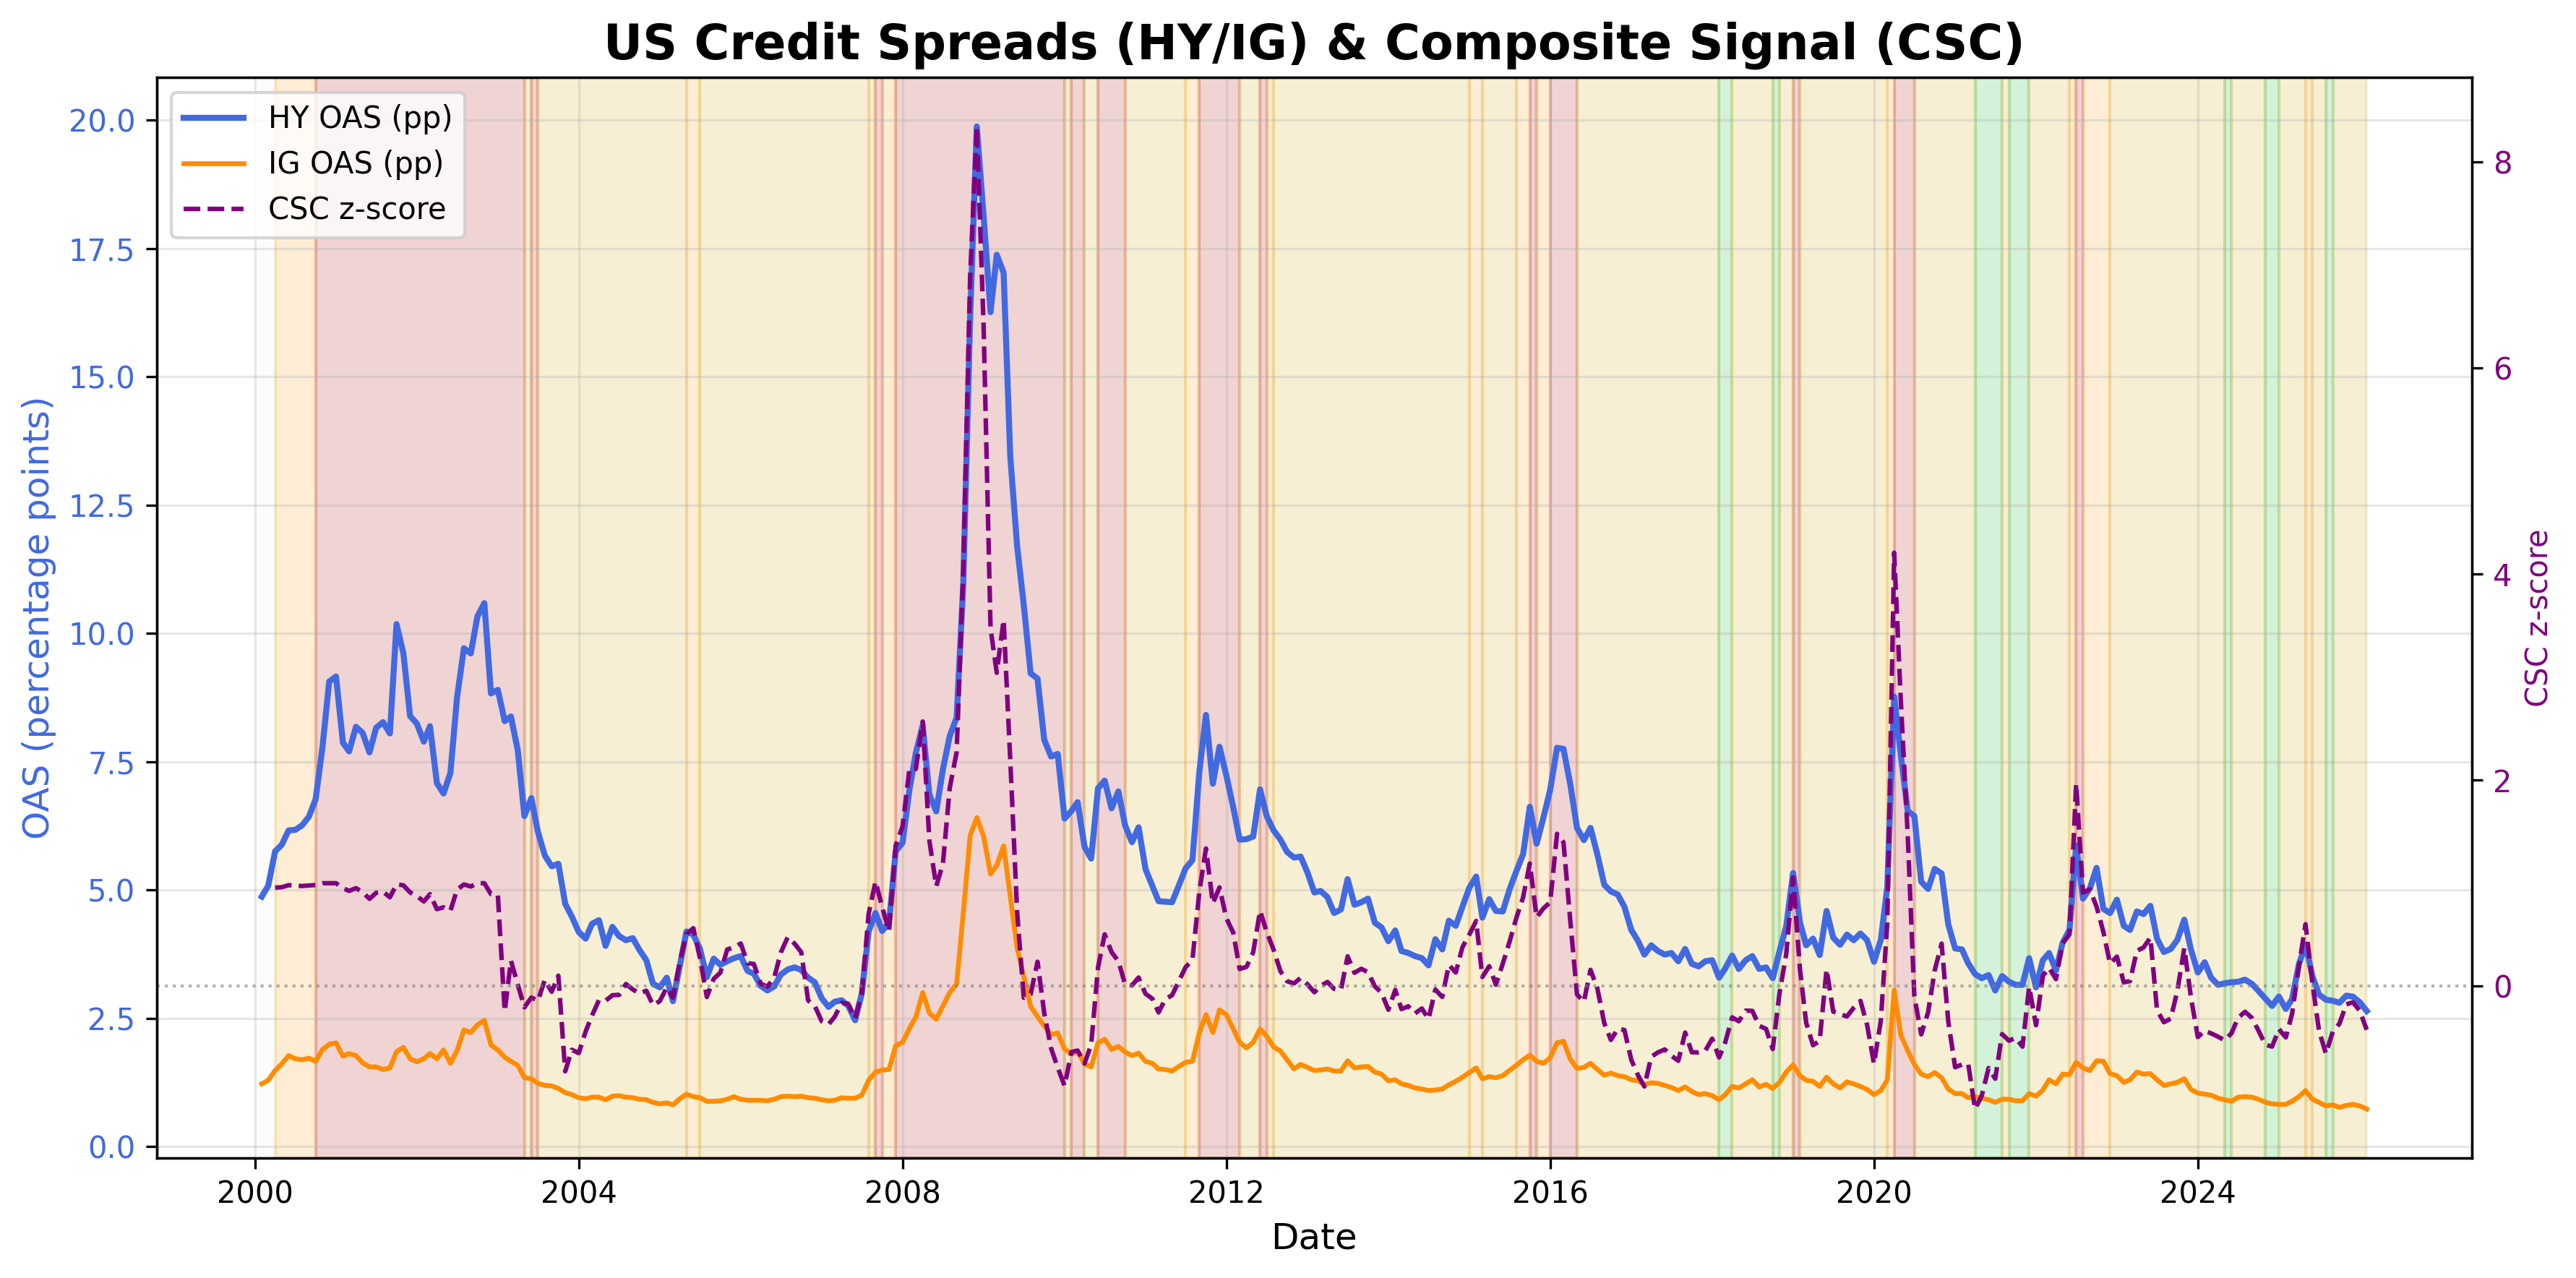
U.S. corporate credit spread dynamics.

Credit Spreads Table
HY_OAS IG_OAS hy_level_z hy_pct_rank hy_d3m_ann_z hy_d12m_z ig_level_z ig_pct_rank ig_d3m_ann_z ig_d12m_z CSC_z CSC_score CSC_regime
Date
2023-04-30 4.53 1.41 0.236932 0.600000 0.506890 0.126340 0.272271 0.679167 0.809389 -0.161072 0.375606 29.021030 NORMAL
2023-05-31 4.69 1.42 0.359219 0.675000 0.872870 0.016302 0.297023 0.704167 0.636312 -0.120804 0.471762 30.801877 NORMAL
2023-06-30 4.05 1.30 -0.126109 0.462500 -0.658620 -1.785532 0.000000 0.525000 -0.687217 -0.825496 -0.233555 17.739042 NORMAL
2023-07-31 3.79 1.19 -0.298075 0.316667 -0.937428 -1.151852 -0.259896 0.341667 -0.974264 -0.803438 -0.349086 15.599348 NORMAL
2023-08-31 3.85 1.22 -0.221646 0.370833 -1.065770 -1.201552 -0.160888 0.404167 -0.833916 -0.644734 -0.314185 16.245745 NORMAL
2023-09-30 4.03 1.25 -0.053501 0.462500 0.141606 -1.286400 -0.074256 0.458333 -0.098108 -0.938422 -0.040883 21.307439 NORMAL
2023-10-31 4.42 1.32 0.244575 0.616667 1.110488 -0.458932 0.099008 0.587500 0.770847 -0.742917 0.369879 28.914957 NORMAL
2023-11-30 3.84 1.11 -0.168145 0.358333 0.160049 -0.769368 -0.408407 0.220833 -0.374717 -0.664572 -0.106459 20.092938 NORMAL
2023-12-31 3.39 1.04 -0.523952 0.100000 -0.785001 -1.221329 -0.569295 0.166667 -0.824378 -0.714167 -0.493144 12.931322 NORMAL
2024-01-31 3.59 1.02 -0.359728 0.183333 -1.036506 -0.721067 -0.606423 0.133333 -1.249057 -0.493284 -0.430469 14.092107 NORMAL
2024-02-29 3.29 1.00 -0.603074 0.070833 -0.609709 -0.830654 -0.668187 0.108333 -0.299774 -0.624156 -0.457565 13.590266 NORMAL
2024-03-31 3.15 0.94 -0.714167 0.033333 -0.142833 -1.123607 -0.819475 0.070833 -0.254525 -1.036904 -0.489122 13.005808 NORMAL
2024-04-30 3.18 0.91 -0.690361 0.050000 -0.422573 -1.025853 -0.895119 0.041667 -0.317407 -0.991898 -0.524624 12.348296 EASY
2024-05-31 3.20 0.88 -0.674491 0.058333 0.098108 -1.045157 -0.970762 0.016667 -0.343858 -1.028720 -0.456151 13.616450 NORMAL
2024-06-30 3.21 0.96 -0.670500 0.070833 0.343377 -0.592458 -0.769046 0.108333 0.396759 -0.640524 -0.305570 16.405287 NORMAL
2024-07-31 3.25 0.97 -0.648159 0.083333 0.359728 -0.291672 -0.743831 0.120833 0.608364 -0.378491 -0.247841 17.474466 NORMAL
2024-08-31 3.17 0.96 -0.712975 0.050000 0.158214 -0.291672 -0.769046 0.112500 0.661265 -0.397901 -0.307180 16.375484 NORMAL
2024-09-30 3.03 0.92 -0.806196 0.008333 -0.049962 -0.480043 -0.869904 0.075000 0.026451 -0.504655 -0.431726 14.068819 NORMAL
2024-10-31 2.88 0.86 -0.912546 0.008333 -0.324755 -0.752651 -0.995977 0.012500 -0.290957 -0.731490 -0.568206 11.541146 EASY
2024-11-30 2.74 0.83 -1.019671 0.008333 -0.399698 -0.477644 -1.030131 0.008333 -0.396759 -0.397901 -0.585918 11.213109 EASY
2024-12-31 2.92 0.82 -0.862721 0.025000 0.108252 -0.118492 -1.026659 0.008333 -0.242817 -0.287650 -0.416047 14.359197 NORMAL
2025-01-31 2.68 0.82 -1.028164 0.008333 -0.016654 -0.346360 -0.997073 0.012500 0.026980 -0.247975 -0.497003 12.859862 NORMAL
2025-02-28 2.87 0.88 -0.857045 0.025000 0.571754 0.015191 -0.818613 0.054167 0.533972 -0.029757 -0.269491 17.073496 NORMAL
2025-03-31 3.55 0.97 -0.307460 0.266667 1.465119 0.530181 -0.588018 0.183333 1.096047 0.271810 0.193163 25.642085 NORMAL
2025-04-30 3.94 1.09 0.003843 0.508333 2.590759 0.756057 -0.299774 0.316667 1.770538 0.573820 0.602499 33.223204 TIGHTENING
2025-05-31 3.32 0.92 -0.465034 0.187500 1.143508 0.370888 -0.680159 0.120833 0.498537 0.294139 0.031462 22.647293 NORMAL
2025-06-30 2.96 0.86 -0.731651 0.050000 -0.714692 0.132520 -0.809389 0.041667 -0.398563 0.020595 -0.434317 14.020829 NORMAL
2025-07-31 2.86 0.79 -0.776230 0.025000 -1.590190 0.037377 -0.958780 0.008333 -1.563592 -0.061785 -0.654204 9.948420 EASY
2025-08-31 2.84 0.81 -0.736138 0.025000 -0.579562 0.078153 -0.895635 0.016667 -0.427726 0.030893 -0.440686 13.902869 NORMAL
2025-09-30 2.80 0.76 -0.761522 0.025000 0.032119 0.155931 -0.995150 0.008333 -0.380482 0.020595 -0.362904 15.343435 NORMAL
2025-10-31 2.94 0.80 -0.654600 0.075000 0.546016 0.371246 -0.856496 0.025000 0.345893 0.226547 -0.174670 18.829637 NORMAL
2025-11-30 2.92 0.82 -0.680035 0.070833 0.546282 0.459462 -0.762020 0.050000 0.354995 0.329522 -0.156518 19.165815 NORMAL
2025-12-31 2.81 0.79 -0.750255 0.033333 0.357422 0.246272 -0.797125 0.020833 0.473966 0.288332 -0.238711 17.643558 NORMAL
2026-01-31 2.88 0.75 -0.687426 0.070833 0.141998 0.474165 -0.858443 0.008333 -0.115627 0.205951 -0.251045 17.415134 NORMAL
2026-02-28 3.12 0.86 -0.508204 0.141667 0.709990 0.518230 -0.638449 0.104167 0.515787 0.286791 -0.035156 21.413505 NORMAL
2026-03-31 3.27 0.90 -0.384347 0.225000 1.266149 0.064622 -0.545771 0.158333 0.861849 0.147368 0.080934 23.563555 NORMAL
Methodology: Credit Spreads Signal
The information presented is for general informational purposes only and does not constitute financial or investment advice. It has been prepared without regard to individual objectives, financial situation, or needs. You should consider whether it is appropriate for your circumstances and seek independent advice where necessary.