Market Volatility (VIX) Signal
VIX market volatility signal: tracking investor fear and uncertainty.
Gemini Summary
Signal Summary:
- Configuration statement: Given a VIX of 16.34 and a composite z-score of -0.51, this setup aligns with Range-biased price paths and Normal volatility, where the dominant risk is Mean reversion, not Regime shift (1).
- The signal has mean-reverted to a NORMAL regime after a significant volatility spike in early June (1).
- Conviction Band: Medium; Interpretation Confidence: High Confidence; Internal Conflict Flag: No. Signal Stability Assessment: Volatile; Threshold Proximity: Near; Revision Sensitivity: Unknown.
Methodology Applied:
- VIX levels between 16 and 20 or MVS z-scores between 0 and 0.5 define a NORMAL regime (1).
- Rising values imply a transition toward risk-off and market contraction; falling values imply expansion (1).
- MVS z-scores ≥ 1.0 (STRESSED) require prioritized risk control and capital preservation (1).
- Market Volatility (VIX) Signal: Latest observation June 17, 2026 (1).
Key Dynamics:
- The dominant driver is the sharp decline in MVS_z from 1.78 to -0.51 within five sessions (1).
- Momentum (d5_z at -3.19) indicates a rapid collapse in short-term options hedging demand (1).
- Stabilisation is evident as the VIX settles near its long-term average following the June 10 peak (1).
- Conditional Invalidation: VIX crossing above 20 or MVS z-score exceeding 0.5.
- Persistence is low; the signal shows high sensitivity to recent spot price action (1).
Scenario Balance:
- Base case dominant: Continued stabilization within the NORMAL regime as realized volatility matches implied levels.
- Upside risk: Transition to CALM regime if VIX falls below 16, supporting carry trades.
- Downside risk: Secondary volatility spike if VIX breaches 20, signaling renewed downside-tail hedging demand.
Time Horizon & Aggregation:
- Time Horizon: Tactical (weeks); signal reflects short-horizon equity market risk sentiment (1).
- Aggregation Weight Hint: Medium; serves as a high-frequency thermometer for risk-on/off positioning.
Macro Relevance:
- Informs equity market sentiment and tail-risk hedging demand through implied 30-day forward volatility (1).
- Economic mechanism: Falling volatility implies expanding risk appetite and lower crash-risk compensation requirements (1).
- Cycle position: Not determined.
- Interacts with liquidity and credit signals; confirm with widening spreads for high-conviction risk-off (1).
Regime Context:
- Recently entered a persistent NORMAL regime following a volatile STRESSED/ELEVATED sequence (1).
- Direction of change: Stabilising.
Model Limitations:
- Month-end snapshots may miss intramonth stress bursts; absolute thresholds are vulnerable to structural shifts (1).
Data & References:
- Market Volatility (VIX) Signal data through June 17, 2026 (1).
- Influential datapoints: VIX (16.34), MVS z-score (-0.51), and d5_z (-3.19).
- Public datasets: CBOE Skew Index and S&P 500 Realized Volatility for depth.
VIX Volatility Chart
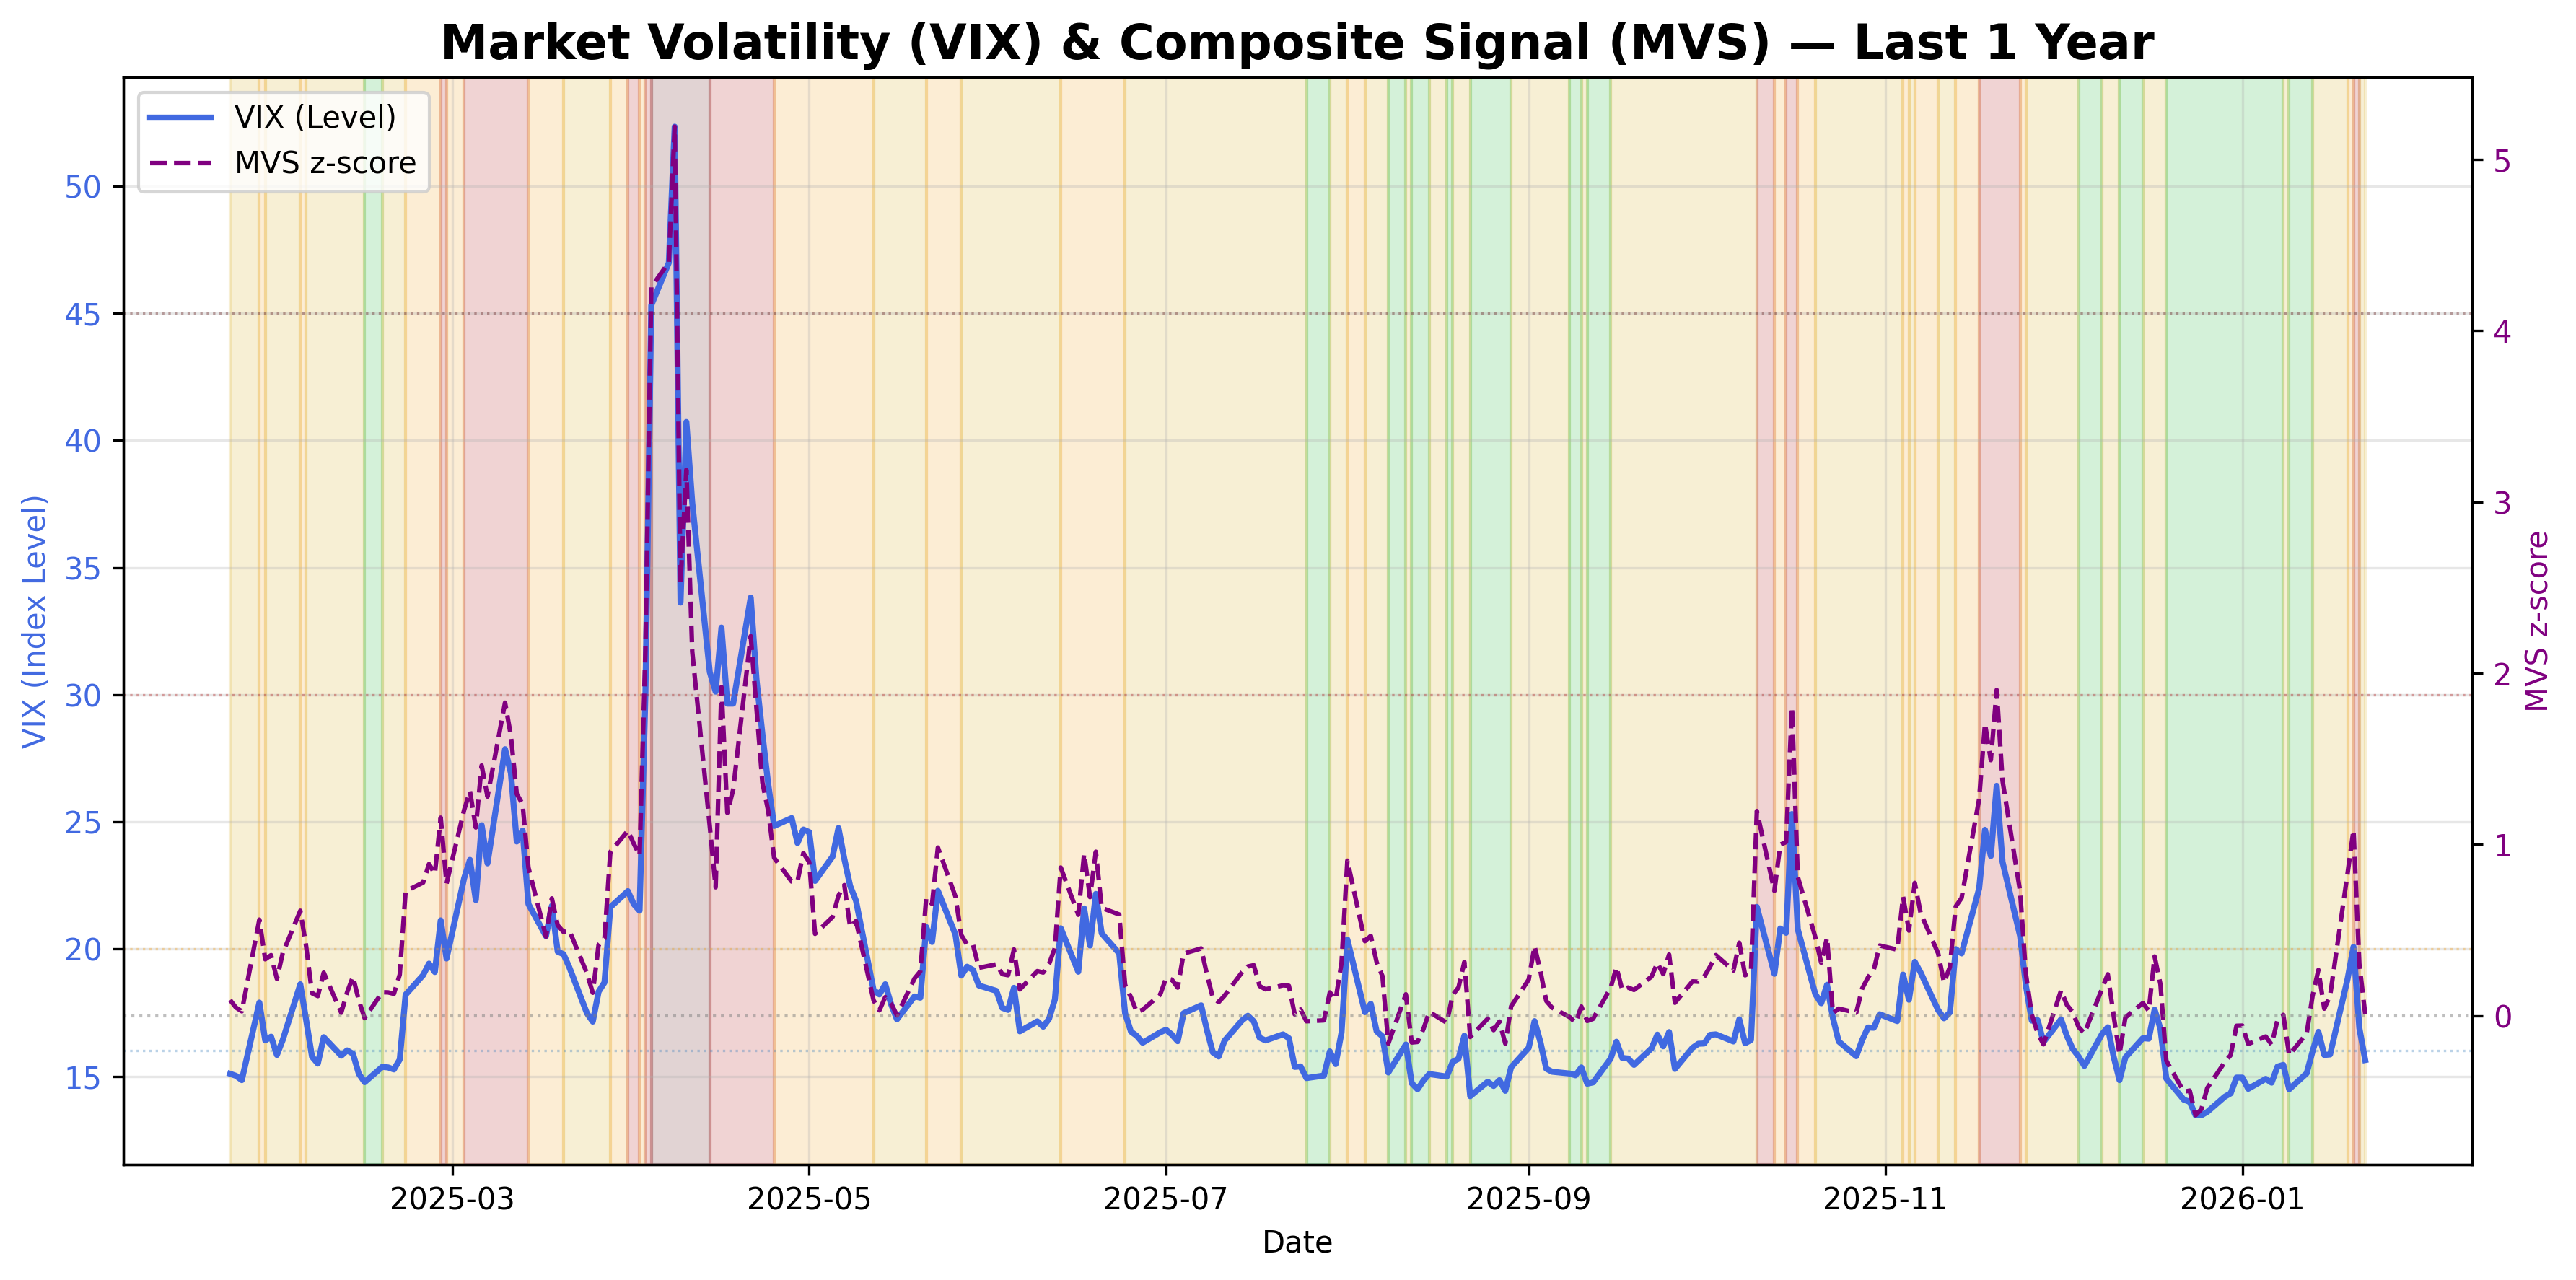
VIX index: market volatility and investor sentiment.
VIX Volatility Table▸
The information on this website is provided for general informational and educational purposes only and does not constitute financial, investment, legal, or tax advice. It does not take into account any individual objectives, financial situation, or needs.
All views expressed are personal, based on publicly available information, and do not represent the views of any employer or reflect any proprietary or internal analysis. This information should not be relied upon for making investment decisions.
No representation or warranty is made as to the accuracy, completeness, or timeliness of the information, and no liability is accepted for any loss arising directly or indirectly from its use.
All views expressed are personal, based on publicly available information, and do not represent the views of any employer or reflect any proprietary or internal analysis. This information should not be relied upon for making investment decisions.
No representation or warranty is made as to the accuracy, completeness, or timeliness of the information, and no liability is accepted for any loss arising directly or indirectly from its use.