Financial Stress Composite Signal
Systemic stress from credit spreads, curve inversion, and financial conditions.
Gemini Summary
Signal Summary:
- Configuration statement: Given a composite value of -0.323084 and a STLFSI4 z-score of -0.378978, this setup aligns with Range-biased price paths and Normal volatility, where the dominant risk is Mean reversion, not Regime shift (1).
- The signal is currently in a Neutral regime, indicating that financial conditions remain near historical norms (1).
- Conviction Band: Medium; Interpretation Confidence: High Confidence; Internal Conflict Flag: No. Signal Stability Assessment: Stable; Threshold Proximity: Moderate; Revision Sensitivity: Unknown.
Methodology Applied:
- Values between -0.75 and 0.75 are classified as Neutral, implying market noise is likely (1).
- Rising composite values indicate a transition toward risk-off or recessionary regimes (1).
- Sub-component contribution analysis (STLFSI4, HY OAS, and T10Y2Y) is required to identify the specific channel of stress (1).
- Financial Stress Composite Signal: latest observation 2025-03-31 (1).
Key Dynamics:
- The primary driver is the St. Louis Fed Financial Stress Index (STLFSI4), which remains below its long-run distribution (1).
- The yield curve (T10Y2Y) has de-inverted to 0.34, contributing a negative z-score (-0.267) which offsets funding pressure (1).
- Conditional Invalidation: A move in the composite value above 0.75 would shift the regime to High Stress (1).
- The signal shows high persistence, remaining in the Neutral band for over 20 consecutive months (1).
Scenario Balance:
- Dominant base case: Continued Neutral regime as sub-components fluctuate within historical distributions.
- Most plausible upside risk: Transition to High Stress triggered by a sudden spike in HY OAS or systemic liquidity events.
- Most plausible downside risk: Shift to Low Stress if funding conditions (STLFSI4) see significant further easing.
Time Horizon & Aggregation:
- Time Horizon: Cyclical (months) due to monthly resampling and regime-based classification (1).
- Aggregation Weight Hint: Medium, as the signal suggests a lack of extreme multi-market strain.
Macro Relevance:
- This signal informs the U.S. financial system's intensity of tightening and risk premia expansion (1).
- The economic mechanism implied is a balanced environment for credit and equity, as stress is not materially elevated (1).
- Cycle position: Not determined.
- Typically interacts with VIX and USD strength to confirm broad risk appetite (1).
Regime Context:
- The Neutral regime is highly persistent, having been entered in July 2023 (1).
- The direction of change is stabilising, with the composite oscillating near its median value (1).
Model Limitations:
- Monthly resampling may fail to capture intra-month liquidity spikes or flash events (1).
- Potential double-counting of volatility and spreads exists due to the internal composition of STLFSI4 (1).
Data & References:
Financial Stress Composite Chart
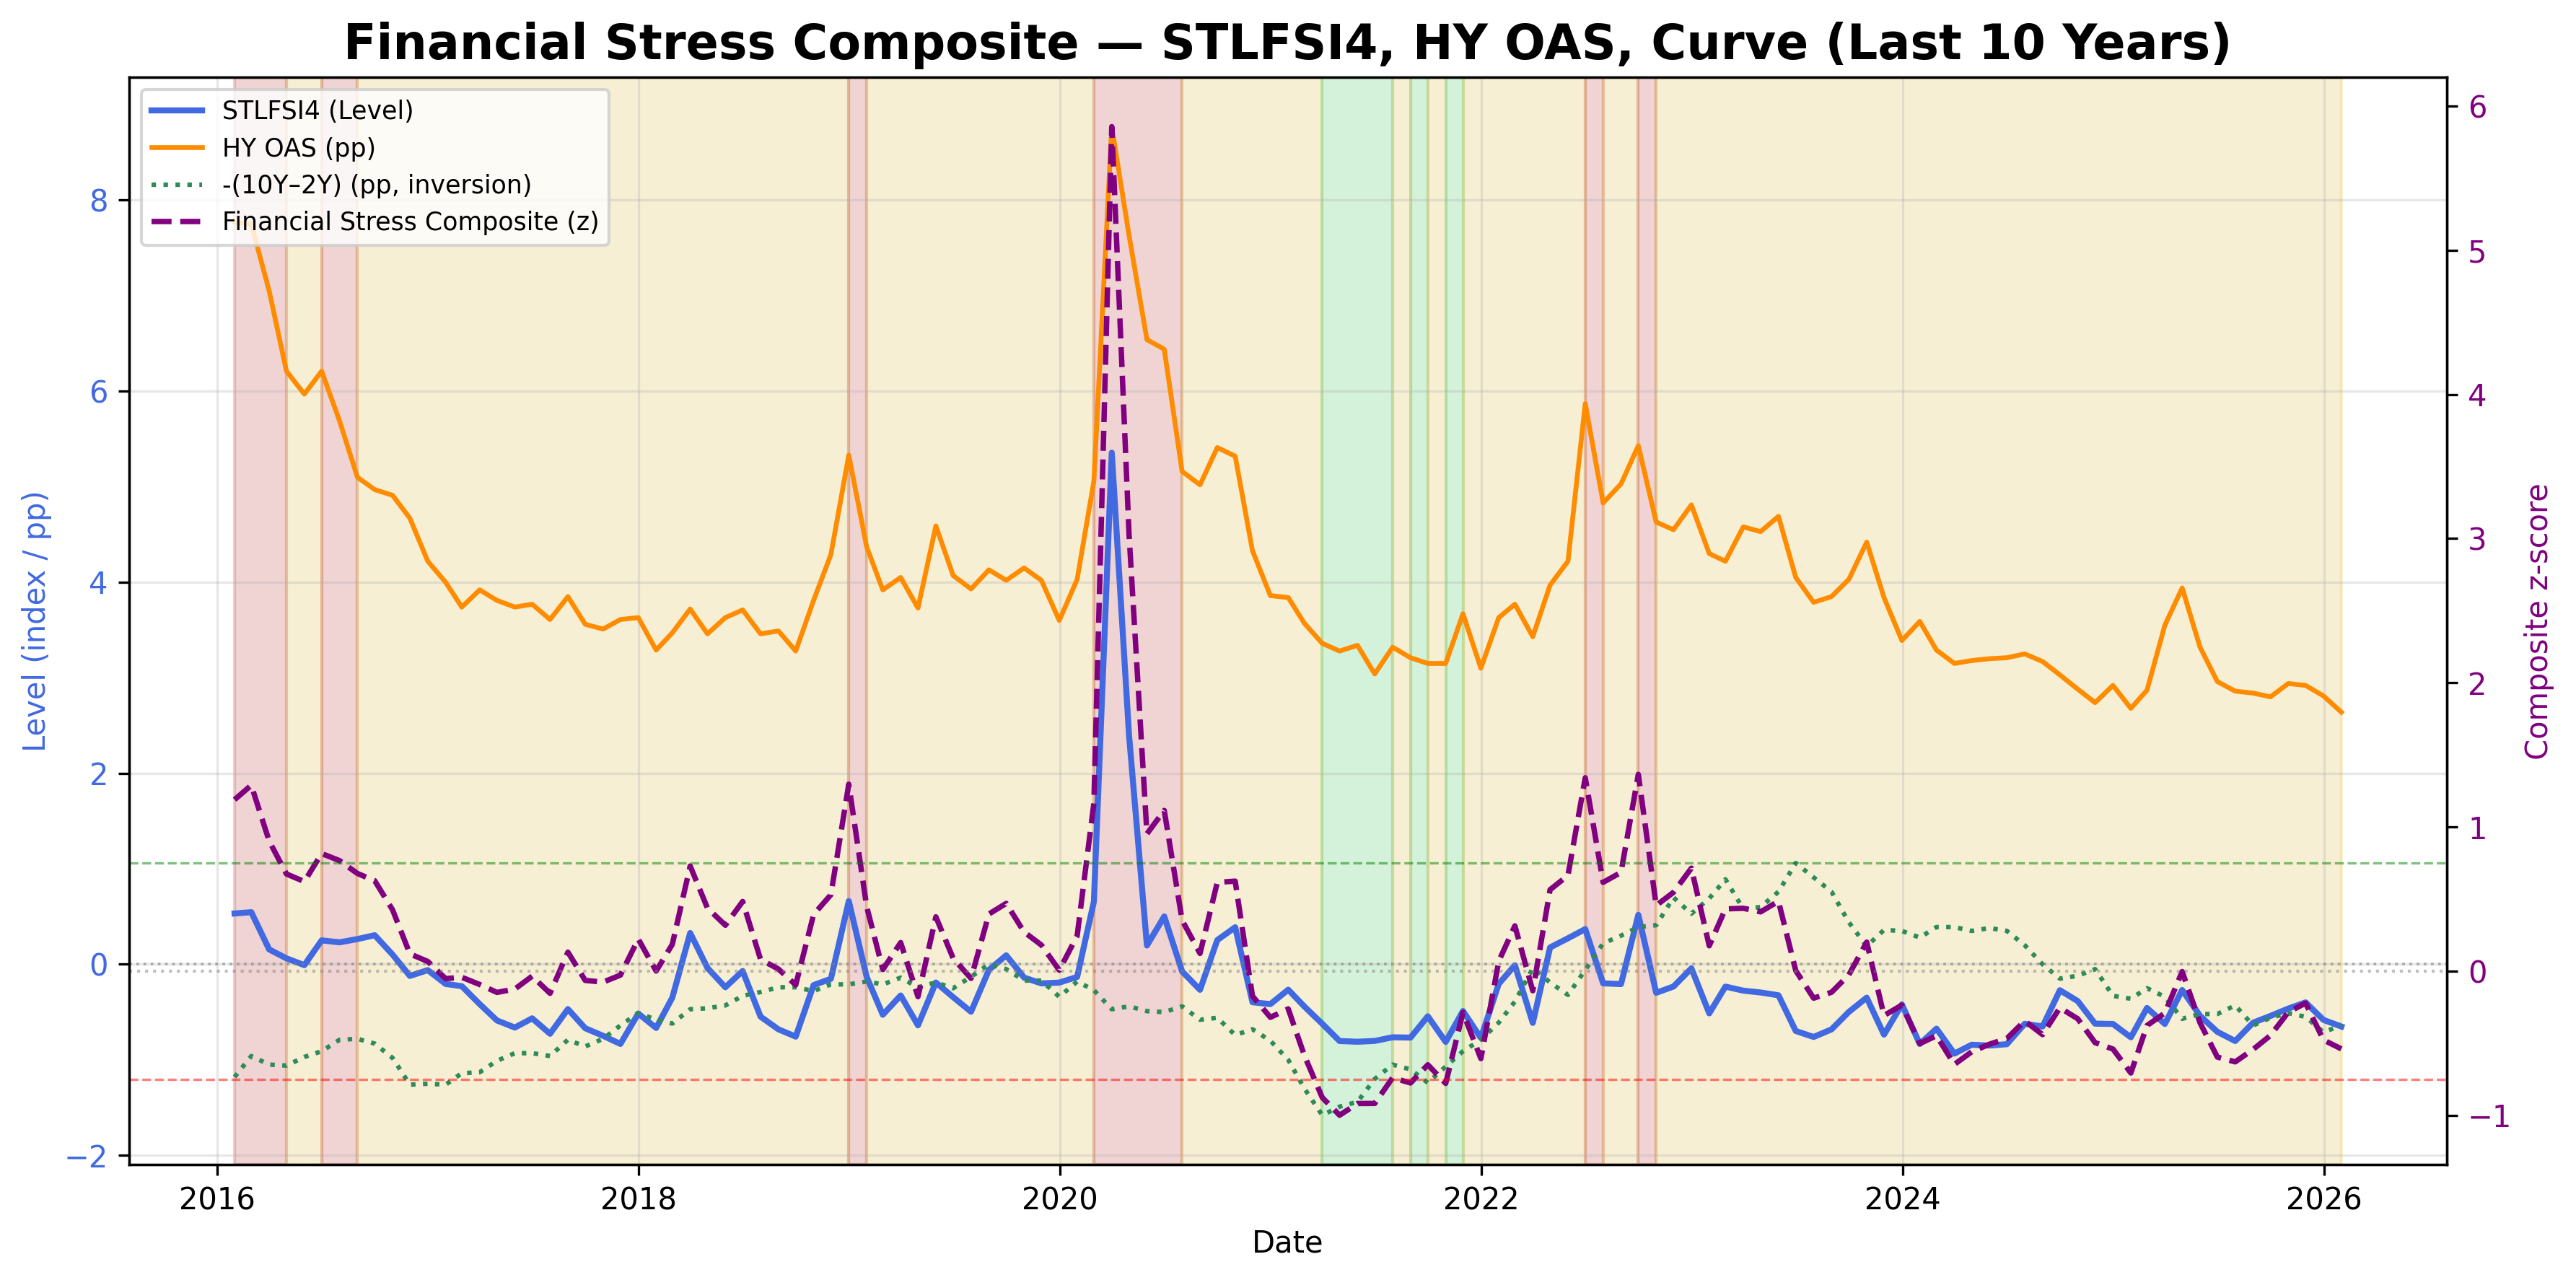
Composite of STLFSI, HY spreads, and yield-curve inversion.
Financial Stress Composite Table▸
The information on this website is provided for general informational and educational purposes only and does not constitute financial, investment, legal, or tax advice. It does not take into account any individual objectives, financial situation, or needs.
All views expressed are personal, based on publicly available information, and do not represent the views of any employer or reflect any proprietary or internal analysis. This information should not be relied upon for making investment decisions.
No representation or warranty is made as to the accuracy, completeness, or timeliness of the information, and no liability is accepted for any loss arising directly or indirectly from its use.
All views expressed are personal, based on publicly available information, and do not represent the views of any employer or reflect any proprietary or internal analysis. This information should not be relied upon for making investment decisions.
No representation or warranty is made as to the accuracy, completeness, or timeliness of the information, and no liability is accepted for any loss arising directly or indirectly from its use.