Federal Reserve Liquidity Composite Signal
Federal Reserve balance sheet, RRP, and reserves as a composite liquidity signal.
Gemini Summary
Signal Summary:
- Configuration statement (mandatory): Given a Liquidity Composite of 0.117, Bullish FED_Signal, and Bullish RRP_Signal, this setup aligns with Range-biased price paths and Compressed volatility, where the dominant risk is Mean reversion, not Trend continuation.
- The signal is currently in a Neutral regime, reflecting a steady recovery toward the expansionary threshold following a long period of contractionary pressure.
- Conviction Band: Medium, Interpretation Confidence: High Confidence, Internal Conflict Flag: No. Signal Stability Assessment: Improving, Threshold Proximity: Near, Revision Sensitivity: Moderate.
Methodology Applied:
- A Liquidity Composite (LC) between -0.75 and 0.75 defines a Neutral regime where conditions lack a clear trend (1).
- Rising composite values indicate expansionary liquidity providing risk-on or inflationary support (1).
- Falling Overnight Reverse Repo (ON RRP) usage is treated as an inverted bullish signal for short-term funding (1).
- Federal Reserve Liquidity Composite Signal, latest observation June 30, 2026 (1).
Key Dynamics:
- The primary driver is the transition of Federal Reserve Total Assets (FED_Signal) to a Bullish state, with YoY growth turning positive at 0.95% (1).
- Stabilisation is evident as the Liquidity Composite has risen from -0.20 in late 2024 to 0.117 currently (1).
- Internal tensions exist as Reserve Balances (RES_Signal) remain Neutral despite improved M2 and Fed Asset trends (1).
- Conditional Invalidation: The Liquidity Composite falling below -0.75 would trigger a Contractionary regime shift (1).
- Signal stability is high, with the composite showing consistent upward momentum over the last four monthly prints (1).
Scenario Balance:
- Base case dominant: Continued liquidity neutralisation as Fed balance sheet contraction ends.
- Upside risk: Shift to Expansionary regime (LC > 0.75) triggered by a surge in M2 growth.
- Downside risk: Reversion to contraction triggered by renewed drainage of Reserve Balances.
Time Horizon & Aggregation:
- Time Horizon: Cyclical (months) as the signal tracks medium-term monetary aggregate and balance sheet trends.
- Aggregation Weight Hint: Medium, reflecting high confidence in the data but a currently neutral regime positioning.
Macro Relevance:
- Informs the Liquidity macro dimension by quantifying central bank and banking system credit availability (1).
- The upward direction implies incremental easing of monetary conditions and a reduction in systemic drainage (1).
- Cycle position: Not determined.
- Interacts with real yields and credit spreads to confirm or conflict with broader financial tightening (1).
Regime Context:
- The signal is persistent within the Neutral regime but is currently strengthening toward the Expansionary threshold.
- Direction of change: Strengthening.
Model Limitations:
- Weekly balance sheet data is subject to release delays and revisions (1).
- Equal weighting of components may mask the outsized impact of specific liquidity channels like the RRP (1).
Data & References:
Federal Reserve Liquidity Composite Chart
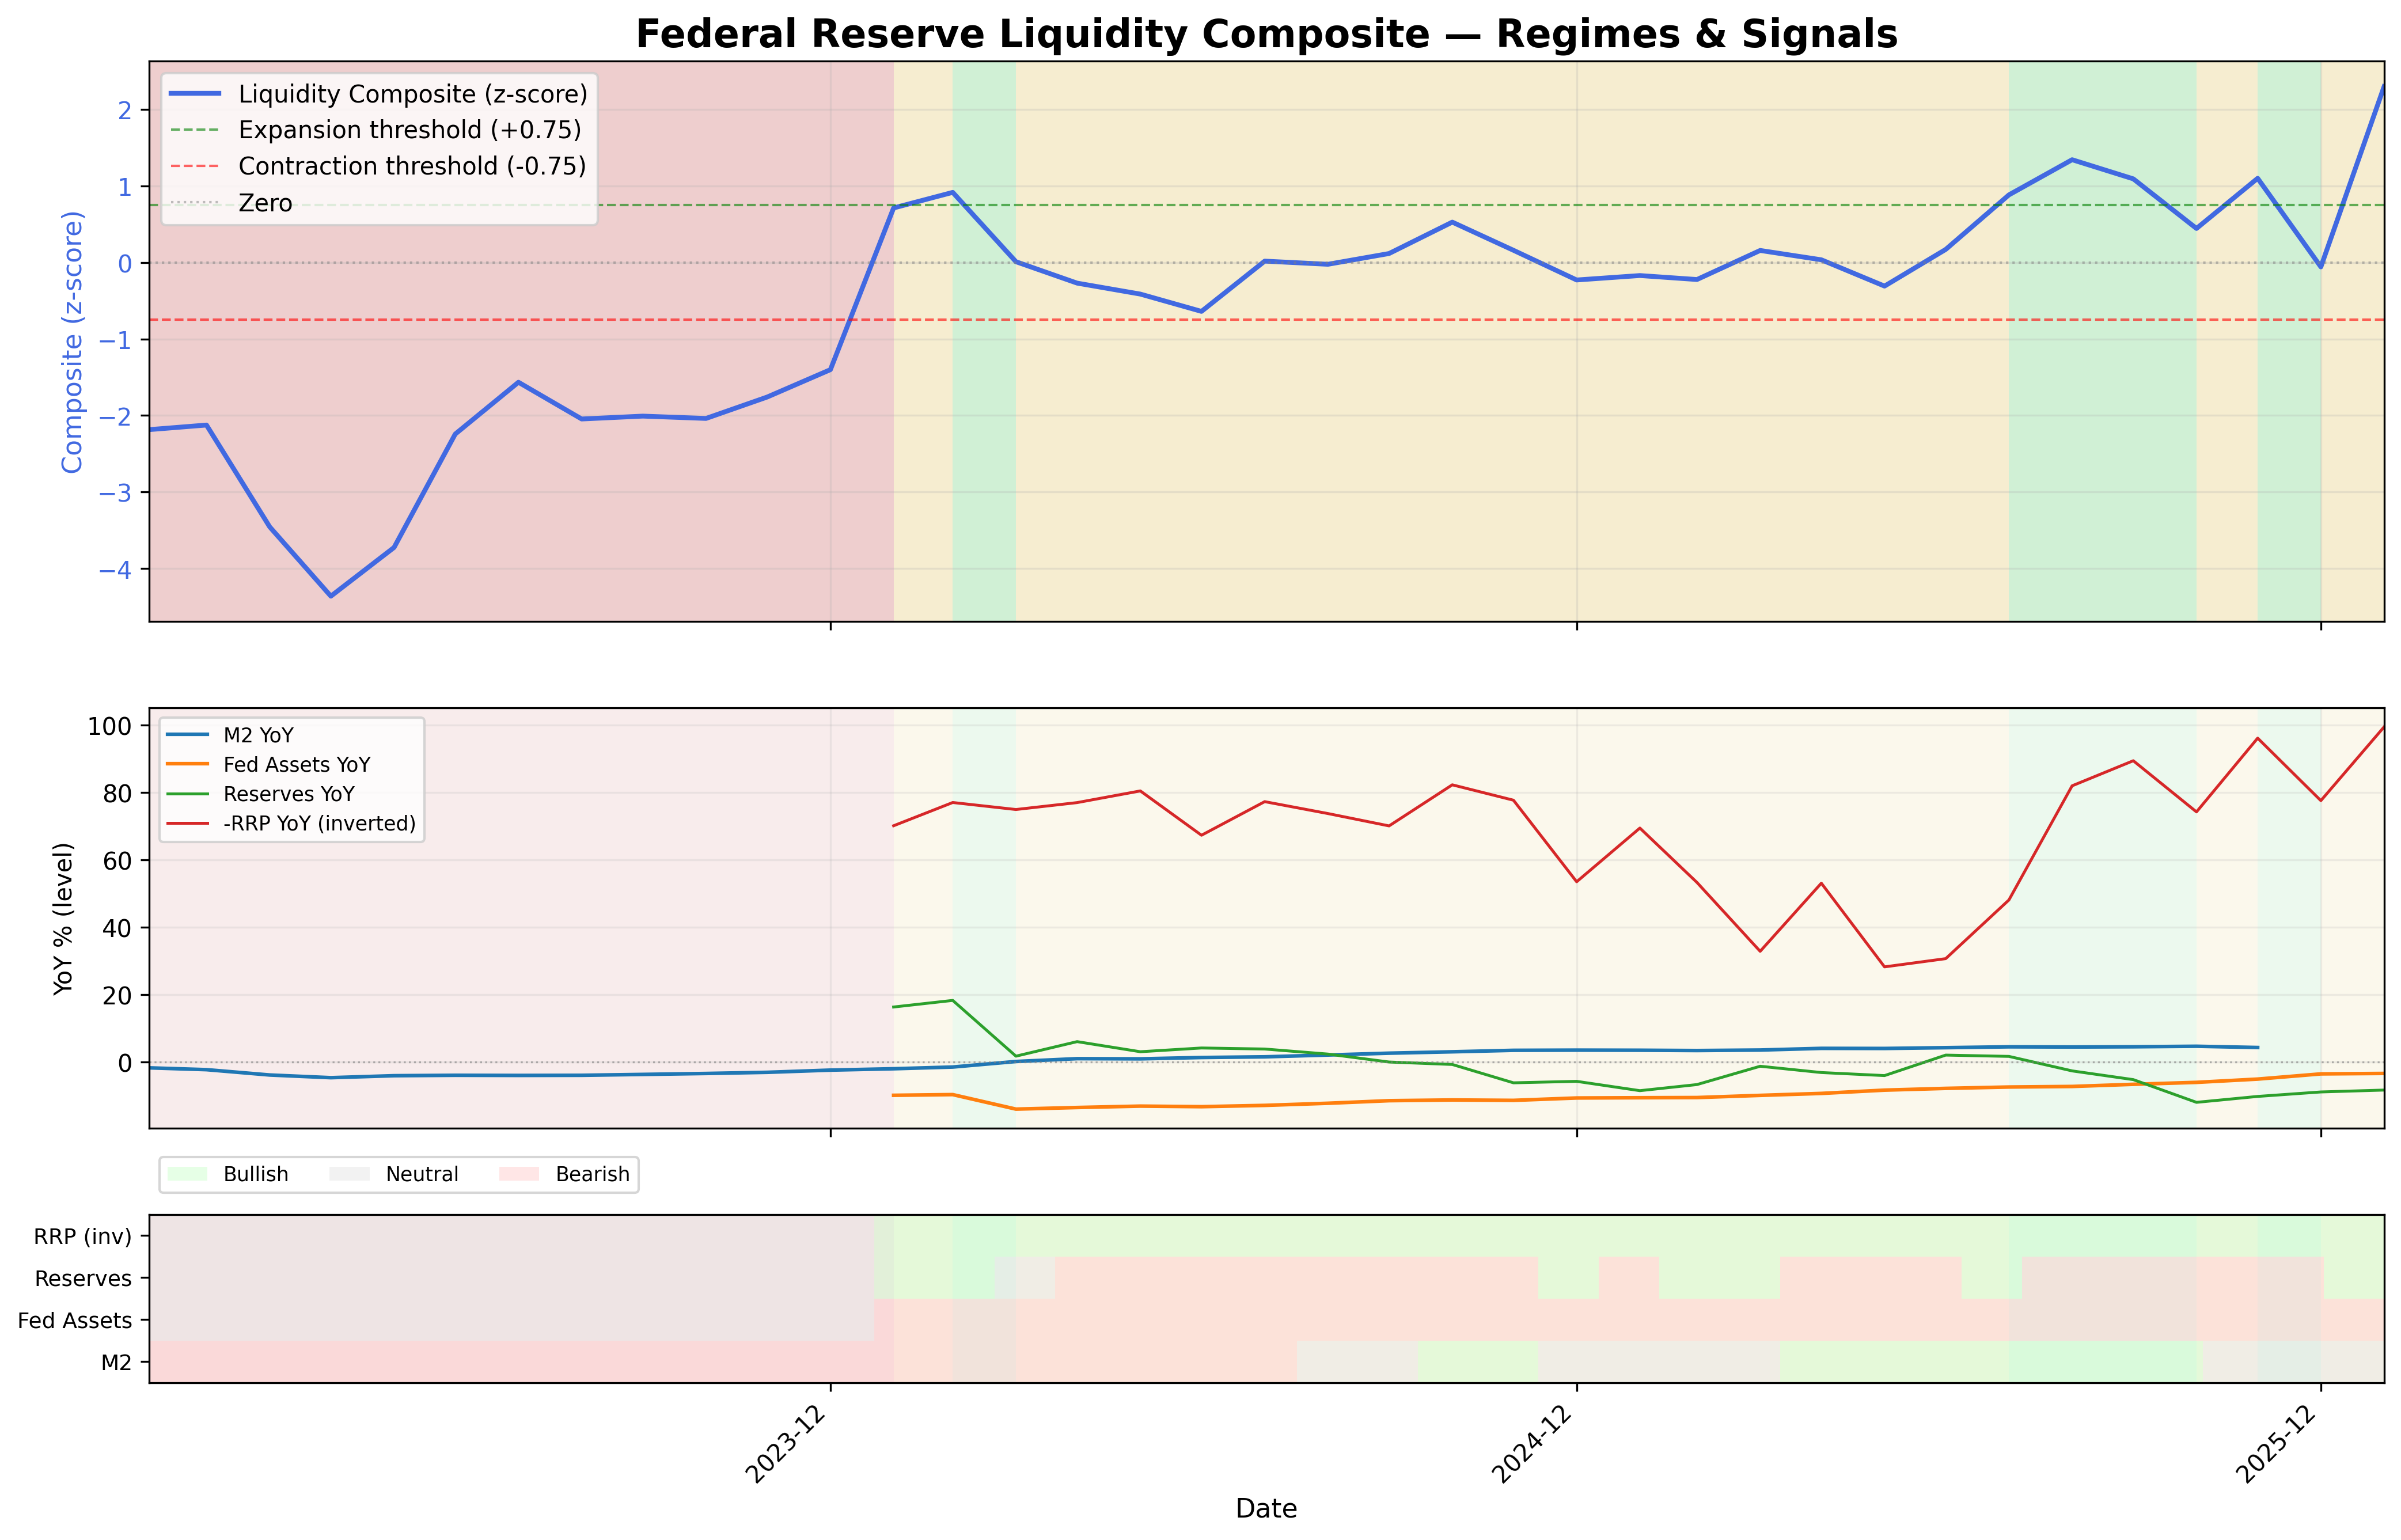
Federal Reserve liquidity composite and signal regimes.
Federal Reserve Liquidity Composite Tables▸
The information on this website is provided for general informational and educational purposes only and does not constitute financial, investment, legal, or tax advice. It does not take into account any individual objectives, financial situation, or needs.
All views expressed are personal, based on publicly available information, and do not represent the views of any employer or reflect any proprietary or internal analysis. This information should not be relied upon for making investment decisions.
No representation or warranty is made as to the accuracy, completeness, or timeliness of the information, and no liability is accepted for any loss arising directly or indirectly from its use.
All views expressed are personal, based on publicly available information, and do not represent the views of any employer or reflect any proprietary or internal analysis. This information should not be relied upon for making investment decisions.
No representation or warranty is made as to the accuracy, completeness, or timeliness of the information, and no liability is accepted for any loss arising directly or indirectly from its use.