Gemini Summary

Signal Summary:

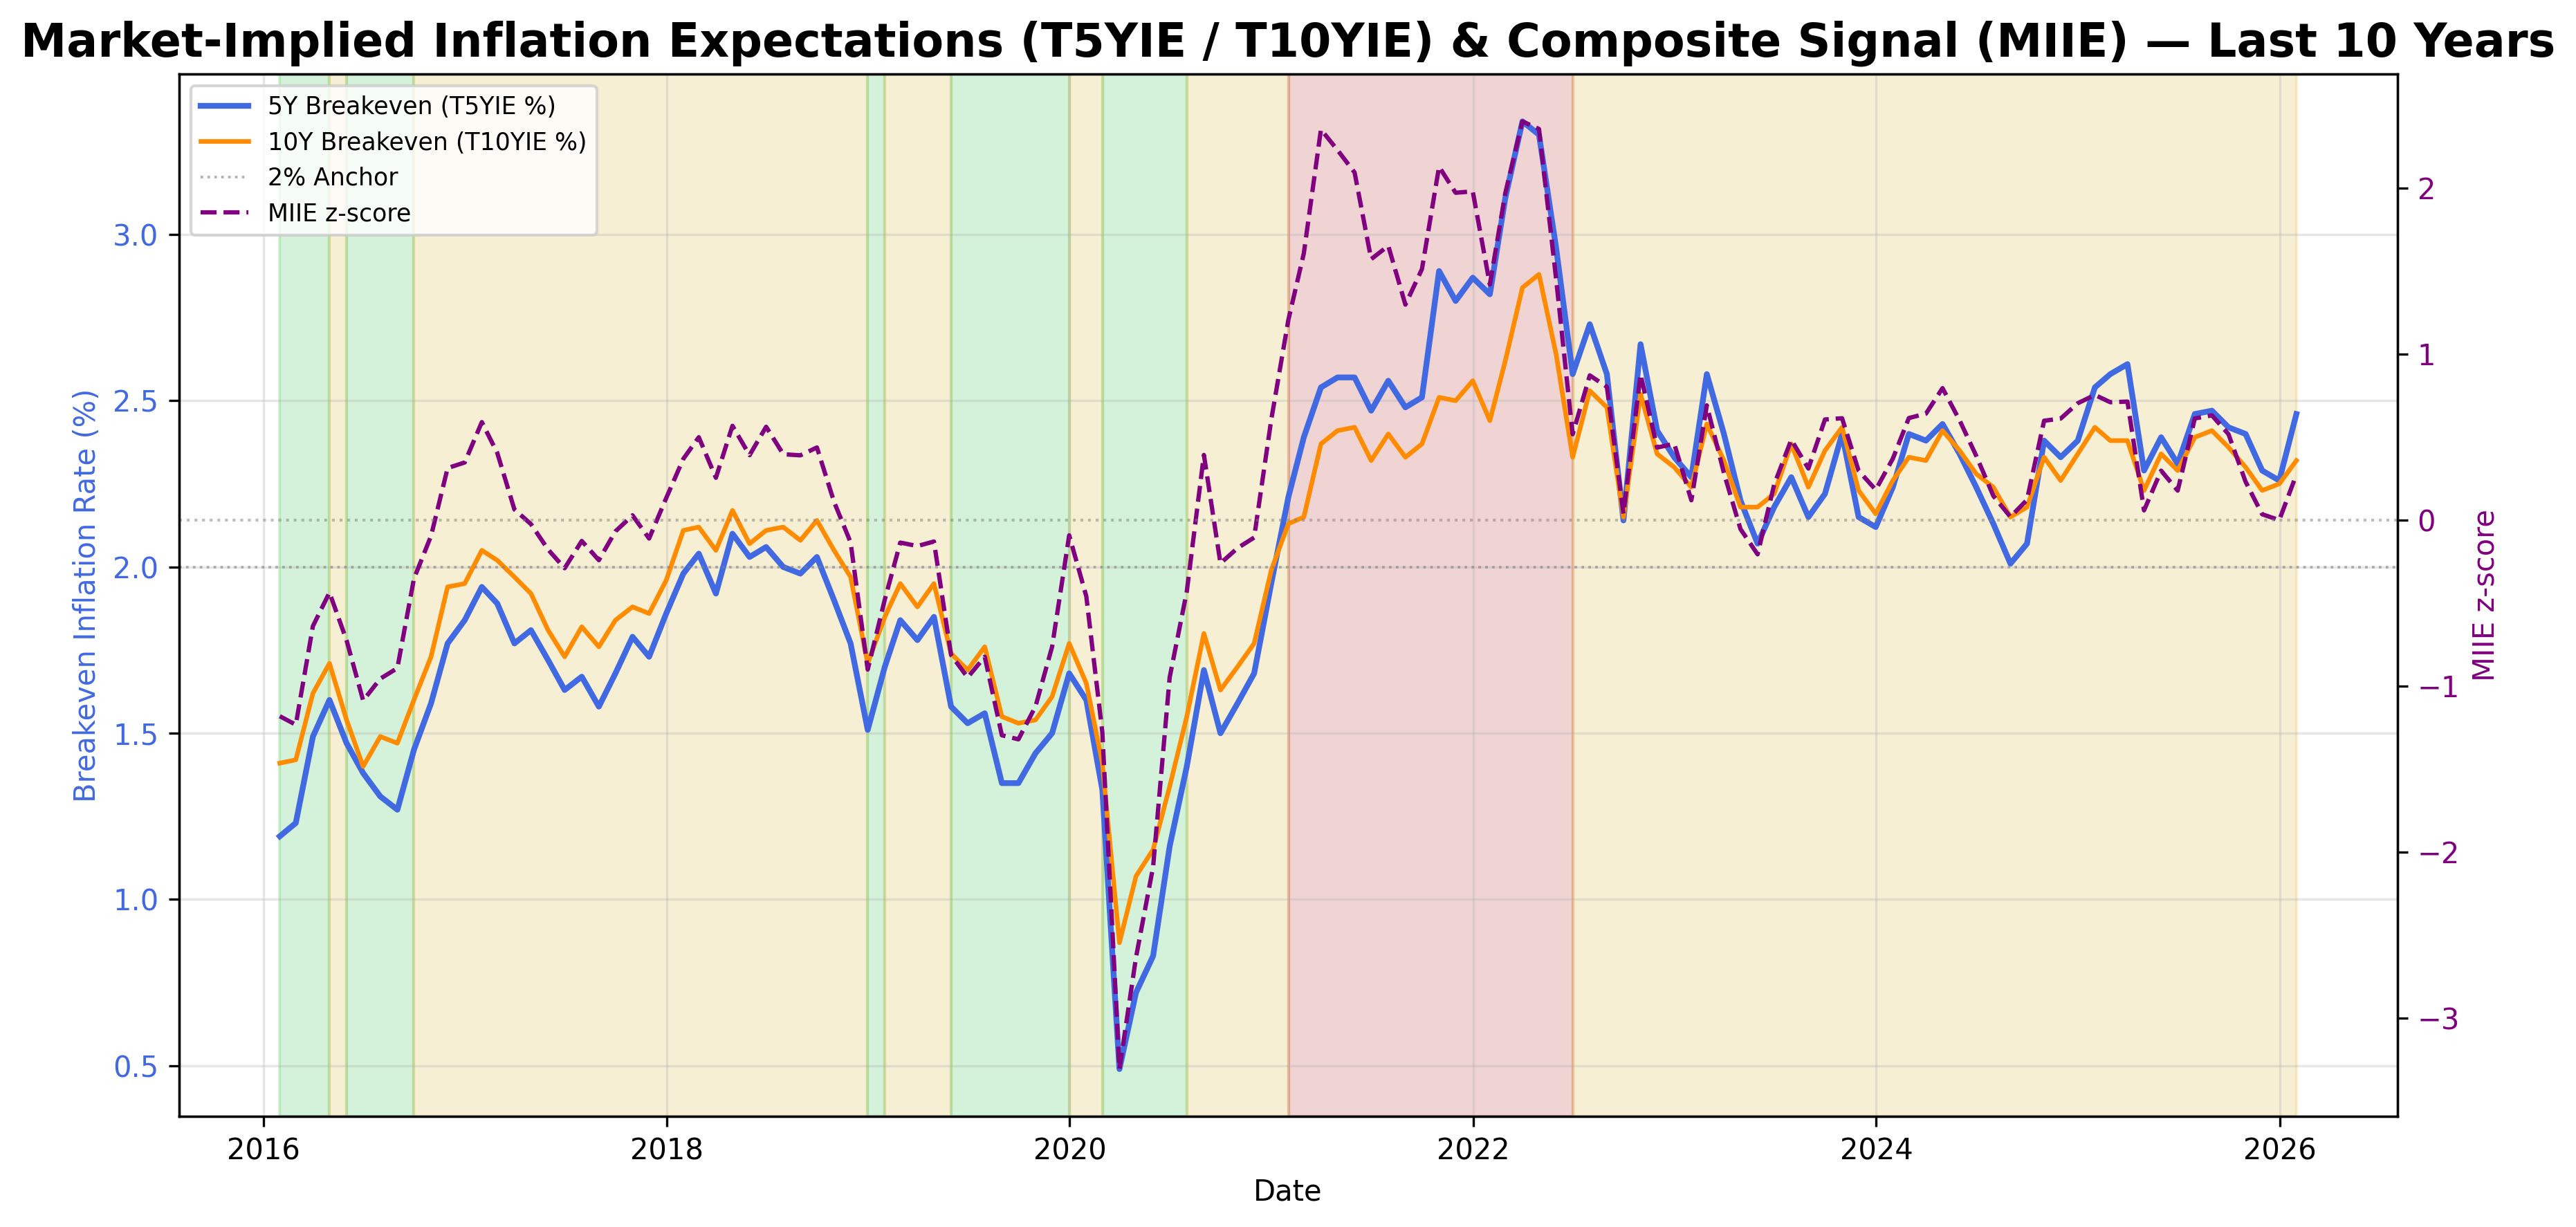
  • Configuration statement: Given a T5YIE of 2.63 and a T10YIE of 2.38, this setup aligns with Range-biased price paths and Normal volatility, where the dominant risk is Mean reversion, not Trend continuation, as the MIIE_z remains within the -0.5 to 1.0 STABLE threshold (1).
  • The signal remains in a STABLE regime, suggesting inflation expectations are consistent with long-term norms (1).
  • Conviction Band: Medium; Interpretation Confidence: Mixed Signals; Internal Conflict Flag: No. Signal Stability Assessment: Improving; Threshold Proximity: Near; Revision Sensitivity: Unknown.

Methodology Applied:

  • Z-scores between -0.5 and 1.0 classify the STABLE regime for inflation compensation (MIIE_z) (1).
  • The signal combines level and momentum for T10YIE and T5YIFR to quantify market-based expectations (1).
  • FALLING signals (z ≤ -0.5) must be discounted if liquidity stress is present (1).
  • Market Implied Inflation Signal; latest observation 2026-03-31 (1).

Key Dynamics:

  • Strong 3-month momentum (t5yie_ann3m_z: 1.15) is the dominant driver of the current score (1).
  • The composite score is stabilising at higher levels, rising from 0.15 to 0.57 in recent months (1).
  • Components show no internal conflict as both 5-year and 10-year breakeven levels are positive (1).
  • Conditional Invalidation: An MIIE_z reading at or above 1.0 triggers a RISING regime shift (1).
  • Signal stability is high, with the STABLE regime persisting for the entire provided 36-month history.

Scenario Balance:

  • Base case dominant: Inflation expectations remain range-bound within long-term historical norms.
  • Upside secondary: Acceleration in inflation compensation if short-term momentum breaks above 1.0 z-score.
  • Downside residual: Disinflationary flight-to-quality event pulls the composite score below -0.5.

Time Horizon & Aggregation:

  • Time Horizon: Cyclical (months) as the signal tracks medium-term inflation compensation trends.
  • Aggregation Weight Hint: Medium due to the data being classified as stale relative to real-time.

Macro Relevance:

  • Informs the pricing dimension by measuring the spread between nominal Treasuries and TIPS (1).
  • Implies an economic mechanism where market-based inflation compensation is currently neutral for policy.
  • Cycle position: Not determined.
  • Typically interacts with realized inflation (CPI/PPI) and liquidity signals for directional confirmation (1).

Regime Context:

  • Current STABLE regime is highly persistent, showing no transitions in the provided data history (1).
  • The direction of change is strengthening, with the composite score trending toward the upper threshold.

Model Limitations:

  • TIPS liquidity premiums and QE supply shifts can artificially distort breakeven levels (1).
  • Signal includes non-inflation risk premia, which may obscure pure inflation expectations (1).

Data & References:

  • Latest dataset: Market Implied Inflation Signal (2026-03-31) (1).
  • Most influential datapoints: T5YIE (2.63) and 3-month annualised z-score (1.15).
  • External realized data like CPI and PPI would improve directional conviction (1).

Market Implied Inflation Chart

Signal chart

Market-implied inflation: investor expectations for future price changes.

Market Implied Inflation Table
T5YIE T10YIE t5yie_level_z t5yie_yoy_z t5yie_ann3m_z t10yie_level_z t10yie_yoy_z t10yie_ann3m_z MIIE_z MIIE_score MIIE_regime
Date
2023-04-30 2.20 2.18 0.791402 -2.255168 -0.215837 0.426516 -1.283708 -0.337245 -0.054890 56.983186 STABLE
2023-05-31 2.07 2.18 0.557579 -1.778203 -1.798642 0.426516 -0.685197 -1.191600 -0.207199 54.315104 STABLE
2023-06-30 2.18 2.22 0.741493 -0.739442 -0.755430 0.509615 0.032119 -0.517110 0.212683 61.670418 STABLE
2023-07-31 2.27 2.37 0.896363 -0.805507 0.291672 0.803438 -0.042825 0.764423 0.483034 66.406319 STABLE
2023-08-31 2.15 2.24 0.678899 -0.741940 0.291672 0.545544 -0.214124 0.186066 0.309747 63.370752 STABLE
2023-09-30 2.22 2.35 0.783280 0.213508 0.109377 0.747278 0.685030 0.529957 0.605146 68.545416 STABLE
2023-10-31 2.40 2.42 1.089562 -0.479638 0.388063 0.864488 0.010706 0.144534 0.612639 68.676684 STABLE
2023-11-30 2.15 2.23 0.652733 -0.459653 -0.092396 0.503493 -0.010706 -0.144534 0.296231 63.133986 STABLE
2023-12-31 2.12 2.16 0.590730 -0.370712 -0.461980 0.370495 -0.074943 -0.976849 0.181548 61.125005 STABLE
2024-01-31 2.24 2.26 0.793519 -0.010377 -0.674491 0.560492 0.239335 -0.809389 0.369345 64.414765 STABLE
2024-02-29 2.40 2.33 1.044373 -0.324174 0.809389 0.688641 -0.021758 0.359728 0.613704 68.695342 STABLE
2024-03-31 2.38 2.32 0.966045 0.000000 0.760964 0.669774 0.089189 0.629525 0.640273 69.160765 STABLE
2024-04-30 2.43 2.41 1.026583 0.531095 0.539593 0.827996 0.501687 0.584559 0.793981 71.853357 STABLE
2024-05-31 2.34 2.35 0.852424 0.616070 -0.305769 0.711449 0.367904 0.000000 0.599370 68.444239 STABLE
2024-06-30 2.24 2.28 0.682716 0.169950 -0.528655 0.582095 0.122635 -0.269796 0.386697 64.718718 STABLE
2024-07-31 2.13 2.24 0.501755 -0.254926 -1.061199 0.508178 -0.200675 -0.818235 0.145115 60.486786 STABLE
2024-08-31 2.01 2.15 0.279667 -0.244304 -1.169117 0.341865 -0.011149 -0.920733 0.018483 58.268509 STABLE
2024-09-30 2.07 2.18 0.372418 -0.265548 -0.601573 0.397303 -0.189526 -0.508632 0.121022 60.064739 STABLE
2024-10-31 2.38 2.33 0.868976 0.000000 0.838556 0.669839 -0.011149 0.314762 0.597611 68.413431 STABLE
2024-11-30 2.33 2.26 0.753112 0.424876 1.020851 0.524604 0.160049 0.418649 0.610550 68.640083 STABLE
2024-12-31 2.38 2.34 0.802768 0.571968 0.984392 0.632040 0.400122 0.674491 0.703059 70.260612 STABLE
2025-01-31 2.54 2.42 1.042771 0.625138 0.425022 0.726375 0.345893 0.313156 0.752762 71.131300 STABLE
2025-02-28 2.58 2.38 1.075875 0.329020 0.747409 0.626991 0.093033 0.457690 0.708990 70.364524 STABLE
2025-03-31 2.61 2.38 1.100703 0.416759 0.674491 0.626991 0.106499 0.072267 0.712929 70.433520 STABLE
2025-04-30 2.29 2.23 0.537937 -0.394824 -1.057310 0.322996 -0.461494 -1.011736 0.057566 58.953136 STABLE
2025-05-31 2.39 2.34 0.674491 0.021935 -0.838556 0.514360 -0.060222 -0.289067 0.296927 63.146165 STABLE
2025-06-30 2.31 2.29 0.526432 0.054837 -1.151131 0.386840 -0.012376 -0.529957 0.176651 61.039218 STABLE
2025-07-31 2.46 2.39 0.748520 0.613173 0.473966 0.559578 0.312264 0.674491 0.611321 68.653595 STABLE
2025-08-31 2.47 2.41 0.740295 0.880740 0.145836 0.593955 0.559955 0.220742 0.629803 68.977355 STABLE
2025-09-30 2.42 2.36 0.645525 0.623479 0.240230 0.483217 0.324274 0.178167 0.516488 66.992345 STABLE
2025-10-31 2.40 2.30 0.619344 -0.124696 -0.388063 0.354995 -0.231643 -0.648549 0.230087 61.975289 STABLE
2025-11-30 2.29 2.23 0.417749 -0.260728 -0.820327 0.194172 -0.231643 -1.094457 0.034273 58.545110 STABLE
2025-12-31 2.26 2.25 0.343858 -0.442103 -0.729179 0.219602 -0.395156 -0.674491 -0.000898 57.928992 STABLE
2026-01-31 2.53 2.36 0.811152 -0.192712 0.309901 0.453258 -0.313400 0.124906 0.403773 65.017856 STABLE
2026-02-28 2.40 2.25 0.559117 -0.578135 0.200524 0.221145 -0.536692 -0.076357 0.155507 60.668842 STABLE
2026-03-31 2.63 2.38 0.916955 -0.124696 1.148457 0.510119 -0.159557 0.483597 0.573450 67.990186 STABLE
Methodology: Market Implied Inflation Signal
The information presented is for general informational purposes only and does not constitute financial or investment advice. It has been prepared without regard to individual objectives, financial situation, or needs. You should consider whether it is appropriate for your circumstances and seek independent advice where necessary.