Inflation Signal
Broad U.S. inflation signal from price-level dynamics.
Gemini Summary
Signal Summary:
- Given the collapse in the composite z-score to 0.008 and the drop in the 0-100 scale to 20.49 (1), this setup aligns with Downward-biased price paths and Indeterminate volatility, where the dominant risk is Regime shift, not trend continuation.
- The signal has entered a transition state (labeled COOL in data) after a sharp disinflationary impulse (1).
- Conviction Band: Low; Interpretation Confidence: Mixed Signals; Internal Conflict Flag: Yes. Signal Stability: Volatile; Threshold Proximity: Near; Revision Sensitivity: Moderate.
Methodology Applied:
- Composite z-scores between -0.25 and +0.25 identify a TRANSITION regime with high flip risk (1).
- Values <= -0.50 define a COOL regime, implying disinflationary or deflationary pressure (1).
- Falling values indicate disinflation, demand slowdown, or the impact of monetary tightening (1).
- US Inflation Signal: Latest observation dated 2026-06-30 (1).
Key Dynamics:
- The primary driver is the rapid decline in the composite z-score from 0.79 to 0.01 (1).
- This momentum shift represents a sharp inflection from NEUTRAL toward disinflationary territory (1).
- Internal Conflict: The data table labels 0.008 as COOL, while methodology thresholds define it as TRANSITION (1).
- Conditional Invalidation: A rise in the composite z-score above +0.25 would signal a return to NEUTRAL.
- Signal stability is currently Volatile due to the large one-month directional move (1).
Scenario Balance:
- Dominant base case: Continued transition into a disinflationary regime as demand pressures fade.
- Upside risk: A reversal in CPI momentum or commodity price spike triggering a NEUTRAL flip.
- Downside risk: A persistent move below the -0.50 threshold confirming a structural COOL regime.
Time Horizon & Aggregation:
- Time Horizon: Cyclical (months) based on the monthly update frequency and 10-year rolling z-score basis (1).
- Aggregation Weight Hint: Low, due to high regime-flip risk and internal conflict between labels and thresholds.
Macro Relevance:
- Informs the pricing and liquidity dimensions by quantifying aggregate latent inflation pressure (1).
- The downward direction implies a transmission mechanism of demand deceleration and cost-push relief (1).
- Cycle position: Not determined.
- Typically confirms liquidity signals; conflicts between production and prices may suggest stagflationary risk (1).
Regime Context:
- Newly entered COOL/TRANSITION state as of June 2026, ending a persistent NEUTRAL phase (1).
- Direction of change: Rapidly weakening inflationary pressure.
Model Limitations:
- CPI is subject to revisions; TIPS liquidity can distort breakevens during periods of market stress (1).
- Revision window cannot be assessed from provided content.
Data & References:
- US Inflation Signal: Composite z-score (0.008), 0-100 scale (20.49), Date: 2026-06-30 (1).
- Relevant external data: Cleveland Fed Inflation Nowcasting, Bloomberg Commodity Index.
Inflation Signal Chart
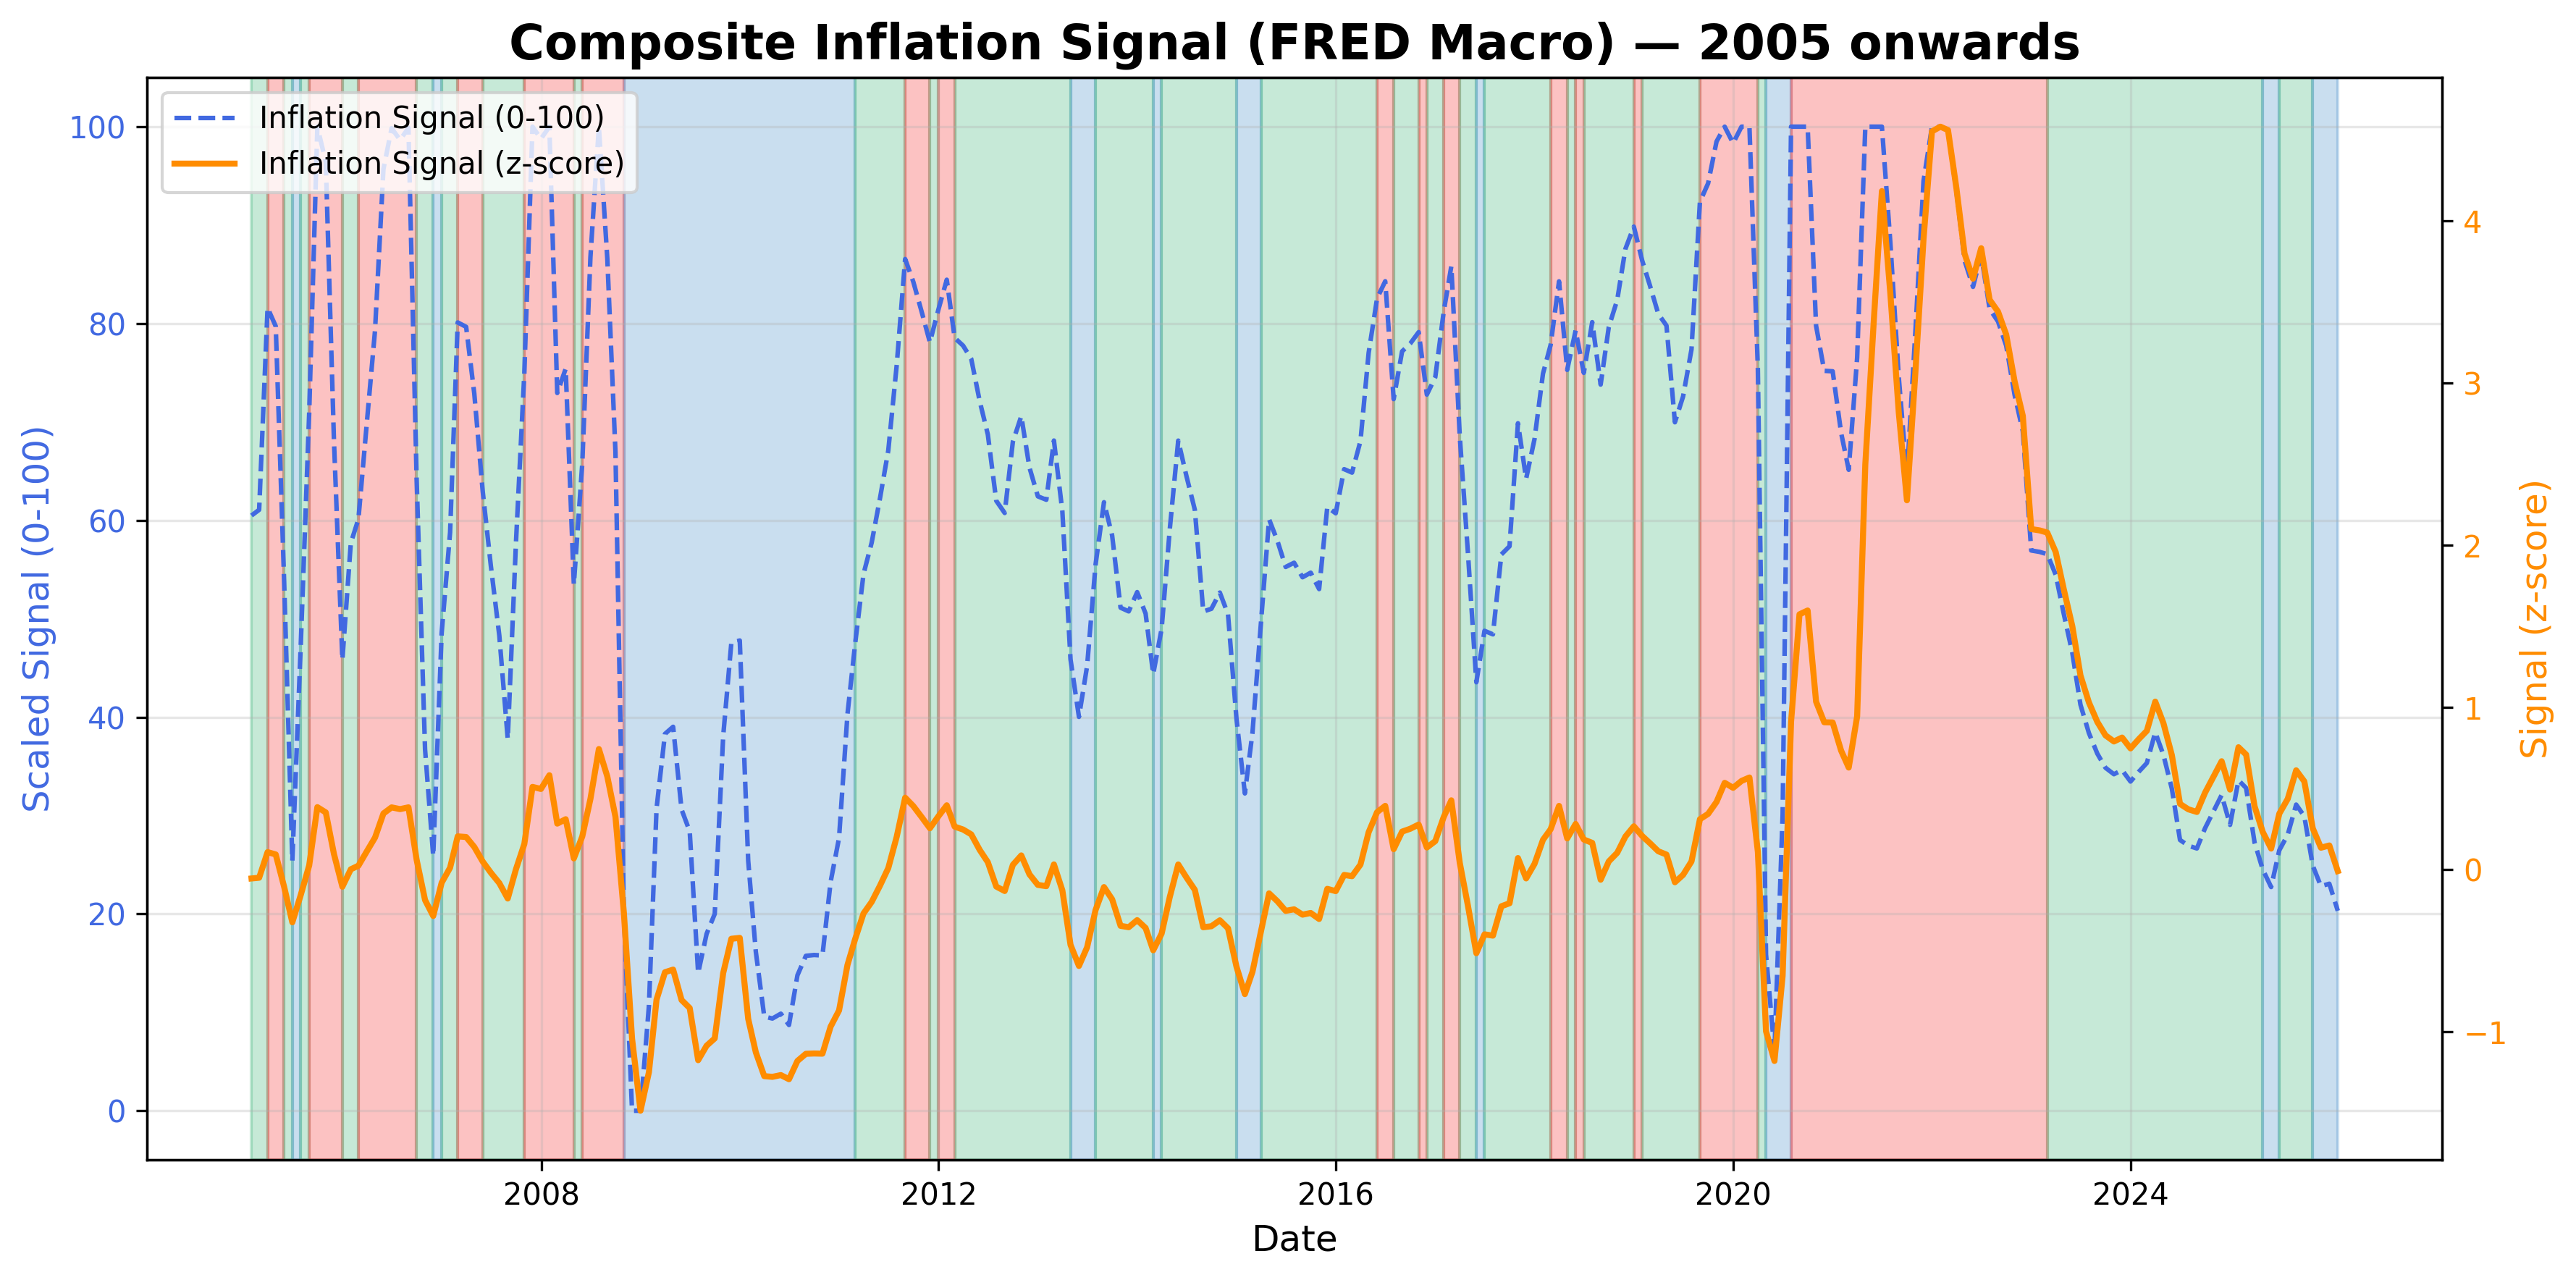
Inflation signal constructed from recent U.S. price dynamics.
Inflation Signal Table▸
The information on this website is provided for general informational and educational purposes only and does not constitute financial, investment, legal, or tax advice. It does not take into account any individual objectives, financial situation, or needs.
All views expressed are personal, based on publicly available information, and do not represent the views of any employer or reflect any proprietary or internal analysis. This information should not be relied upon for making investment decisions.
No representation or warranty is made as to the accuracy, completeness, or timeliness of the information, and no liability is accepted for any loss arising directly or indirectly from its use.
All views expressed are personal, based on publicly available information, and do not represent the views of any employer or reflect any proprietary or internal analysis. This information should not be relied upon for making investment decisions.
No representation or warranty is made as to the accuracy, completeness, or timeliness of the information, and no liability is accepted for any loss arising directly or indirectly from its use.