Policy-Relevant Inflation (PCE) Signal
Policy-relevant inflation: composite of headline and core PCE.
Gemini Summary
Signal Summary:
- Configuration statement (mandatory): Given PCE YoY and Core PCE YoY levels of 3.77% and 3.29% respectively, this setup aligns with Range-biased price paths and Normal volatility, where the dominant risk is Mean reversion, not Regime shift.
- The signal remains in a persistent Neutral regime with a composite z-score of 0.127 (1).
- Conviction Band: Medium; Interpretation Confidence: High Confidence; Internal Conflict Flag: No. Signal Stability Assessment: Improving; Threshold Proximity: Near; Revision Sensitivity: Moderate.
Methodology Applied:
- A composite score between -0.75 and 0.75 defines a Neutral regime where inflation is within historical variance (1).
- Values above 0.75 indicate a Hot regime, suggesting hawkish policy bias and upward pressure on nominal yields (1).
- Directional increases in z-scores imply inflationary expansion and a risk-off bias (1).
- The latest observation is dated 2026-04-30 (1).
Key Dynamics:
- The primary driver is the rising Headline PCE YoY rate, which increased from 2.86% to 3.77% over two months (1).
- The signal shows upward momentum, with the composite score rising from -0.233 to 0.127 since February 2026 (1).
- Internal tension exists as Core PCE momentum (Z_cPCE at -0.08) lags the sharper acceleration in Headline PCE (Z_PCE at 0.34) (1).
- Conditional Invalidation: A composite score exceeding 0.75 would trigger a shift to a Hot regime (1).
- The signal has been stable in the Neutral zone for 32 consecutive months (1).
Scenario Balance:
- Dominant base case: Persistence of the Neutral regime as scores remain well within historical target variance.
- Upside risk: Transition to a Hot regime if 3-month annualized momentum continues to exceed YoY rates.
- Downside risk: Return to disinflationary Neutral levels if base effects or cooling demand suppress PCEPI growth.
Time Horizon & Aggregation:
- Cyclical (months): Reflects multi-month trends in consumer expenditure and policy distance (1).
- Aggregation Weight Hint: High; PCE is the Federal Reserve's primary metric for assessing the 2% target (1).
Macro Relevance:
- Macro dimension: Informed pricing and monetary policy sentiment.
- Economic mechanism: Rising inflation implies potential valuation compression for long-duration assets and shifting policy expectations (1).
- Cycle position: Not determined.
- Interaction: Typically confirms trends in CPI, Dallas Fed Trimmed Mean, and labor market slack (1).
Regime Context:
- The current Neutral regime is highly persistent, having been maintained since late 2023 (1).
- Direction of change: Strengthening toward the upper "Hot" threshold due to recent price acceleration (1).
Model Limitations:
- Lagging monthly frequency and susceptibility to material BEA revisions (1).
- Z-scores may be distorted by structural economic breaks (1).
Data & References:
Policy-Relevant Inflation (PCE) Chart
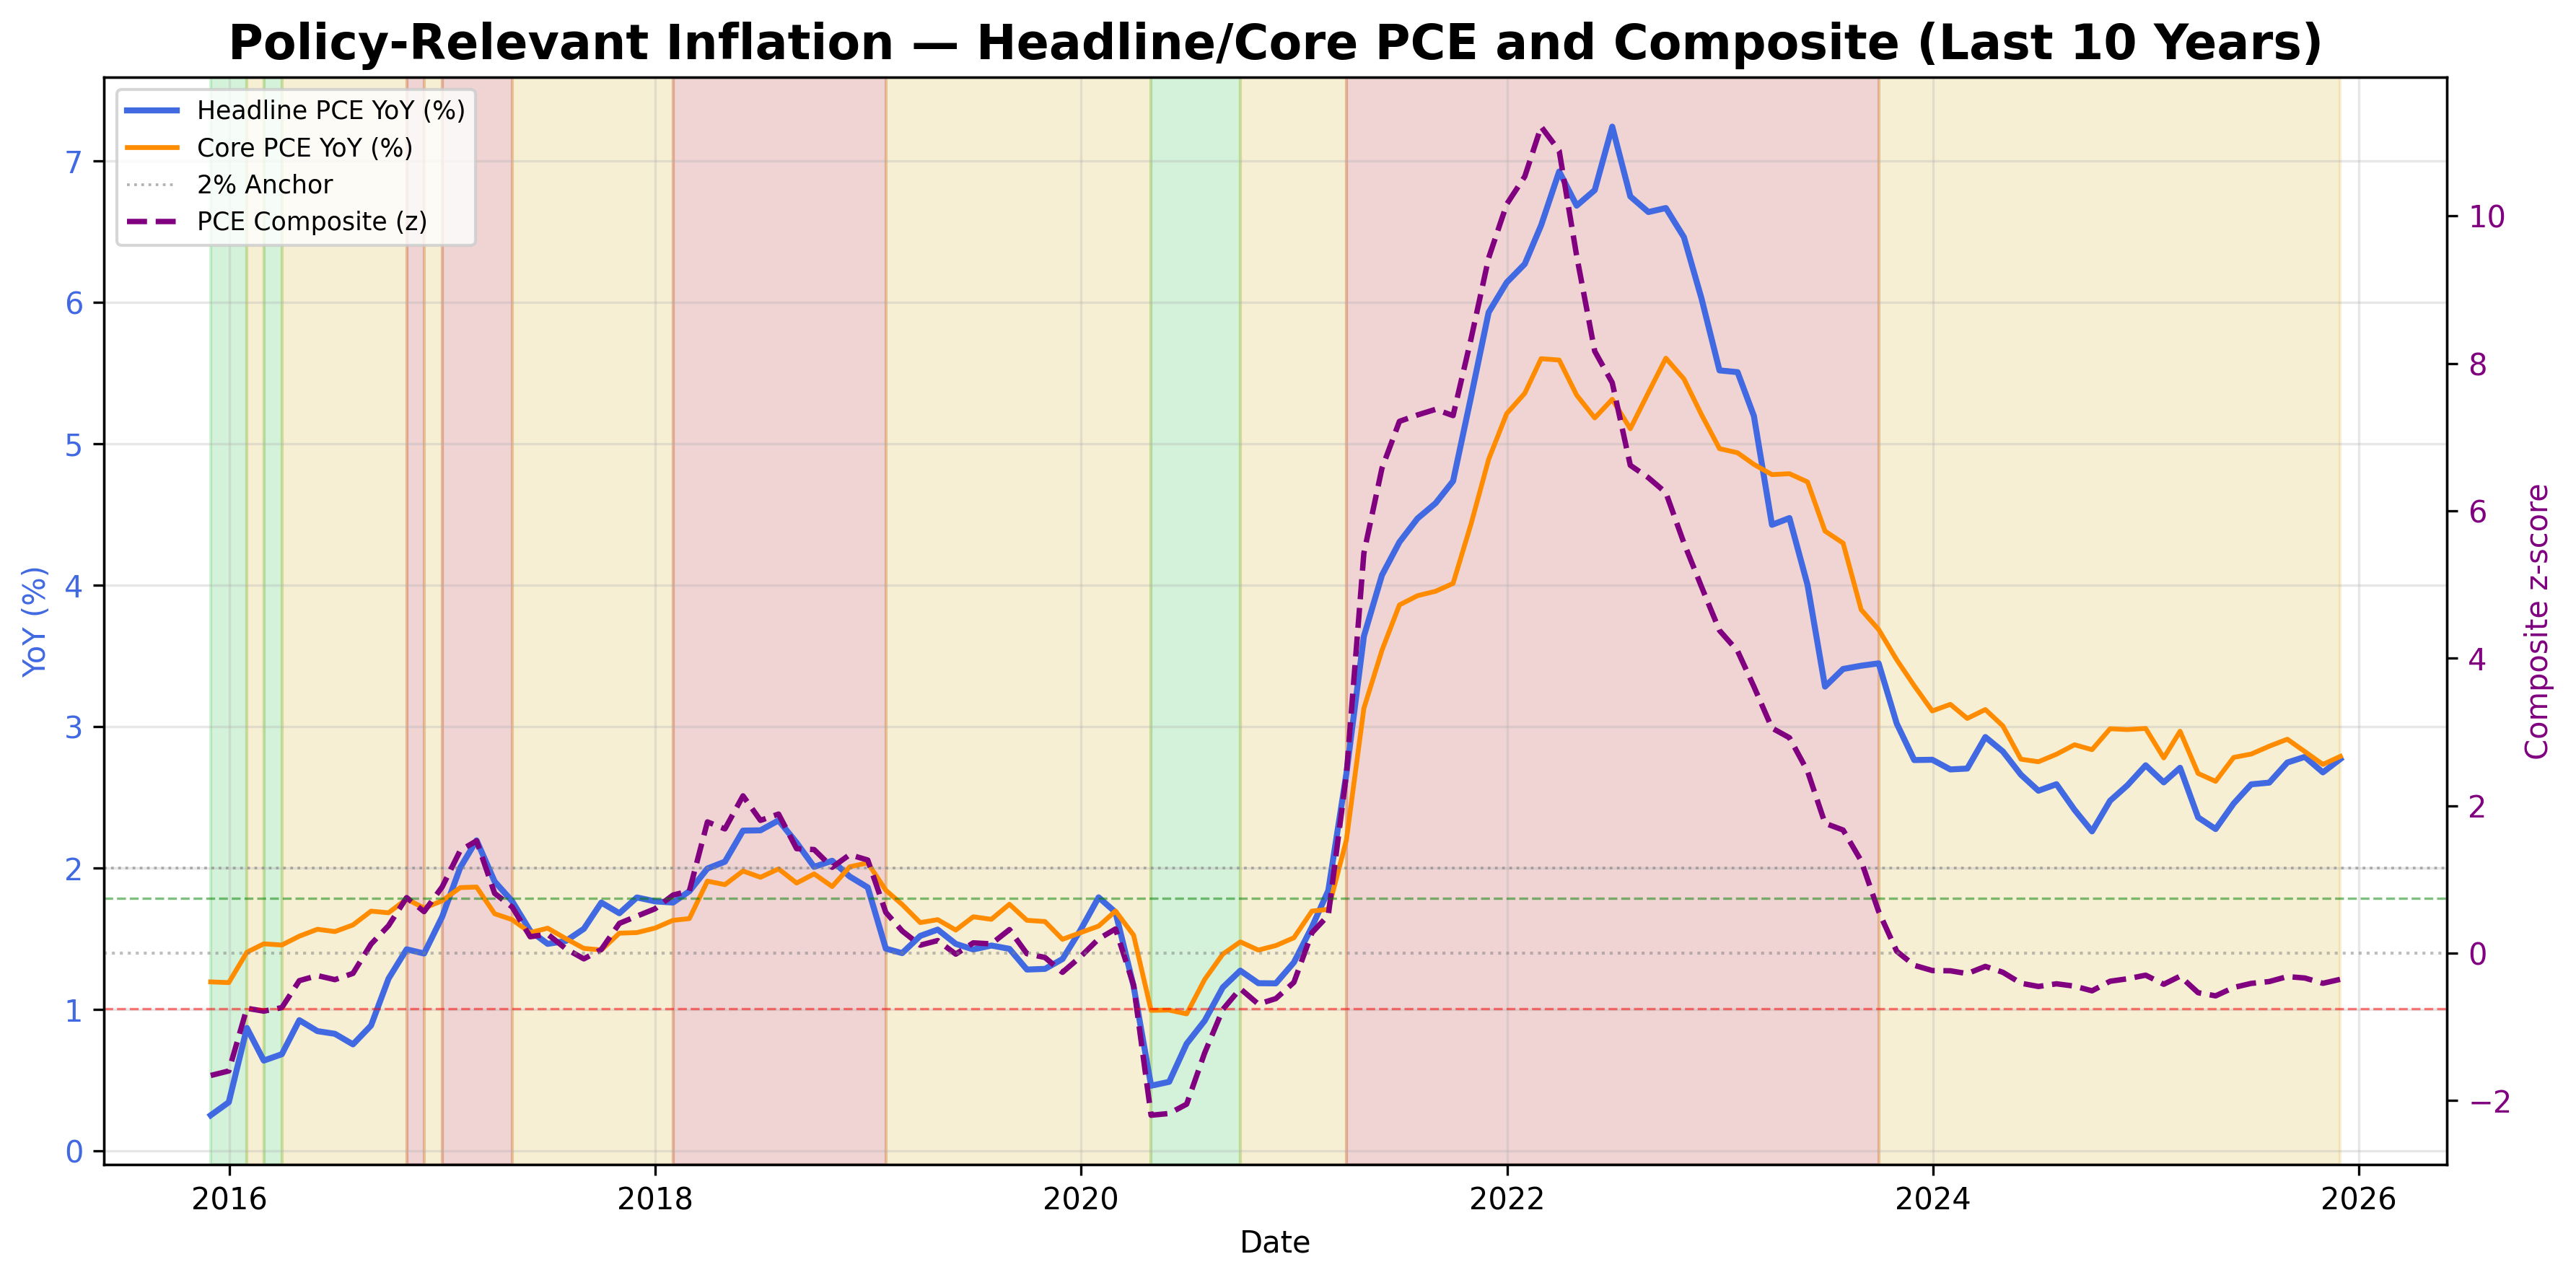
Equal-weight composite of headline and core PCE, scaled into a policy-relevant inflation index.
Policy-Relevant Inflation (PCE) Table▸
The information on this website is provided for general informational and educational purposes only and does not constitute financial, investment, legal, or tax advice. It does not take into account any individual objectives, financial situation, or needs.
All views expressed are personal, based on publicly available information, and do not represent the views of any employer or reflect any proprietary or internal analysis. This information should not be relied upon for making investment decisions.
No representation or warranty is made as to the accuracy, completeness, or timeliness of the information, and no liability is accepted for any loss arising directly or indirectly from its use.
All views expressed are personal, based on publicly available information, and do not represent the views of any employer or reflect any proprietary or internal analysis. This information should not be relied upon for making investment decisions.
No representation or warranty is made as to the accuracy, completeness, or timeliness of the information, and no liability is accepted for any loss arising directly or indirectly from its use.