CPI vs PPI Divergence Signal
Consumer vs producer inflation divergence as a margin-pressure indicator.
Gemini Summary
Signal Summary:
- Configuration statement (mandatory): Given a PPI YoY of 13.07%, a CPI YoY of 4.16%, and a divergence z-score of 1.64, this setup aligns with Upward-biased price paths and Elevated volatility, where the dominant risk is Trend continuation, not Mean reversion.
- The signal is currently in a HOT (inflation pressure) regime, indicating significant upstream price growth exceeding consumer rates (1).
- Conviction Band: High; Interpretation Confidence: High Confidence; Internal Conflict Flag: No. Signal Stability Assessment: Improving; Threshold Proximity: Far; Revision Sensitivity: High.
Methodology Applied:
- A z-score ≥ 1.0 defines a HOT regime, signaling significant upstream price pressure (1).
- Positive divergence (PPI > CPI) explicitly indicates inflationary/expansionary pressure within the production chain (1).
- Pass-through from producer to consumer prices is defined as lagged and non-linear (1).
- CPI vs PPI Divergence Signal, latest observation: 2026-05-31 (1).
Key Dynamics:
- The primary driver is the sharp acceleration in PPI YoY to 13.07%, pushing the z-score to 1.64 (1).
- The signal shows strengthening momentum, with the PPI-CPI gap widening from 3.46 to 8.91 points over three months (1).
- No internal tensions are present as both z-score and absolute CPI (4.16%) confirm the HOT classification (1).
- Conditional Invalidation: A z-score retreat below 1.0 while CPI remains elevated (1).
- The signal has shown high persistence, remaining in the HOT regime for two consecutive months with increasing magnitude.
Scenario Balance:
- Dominant base case: Continued inflationary pressure as upstream costs are passed to consumers.
- Most plausible upside risk: Acceleration in CPI YoY as retailers exhaust margin absorption capacity.
- Most plausible downside risk: Sudden commodity price collapse reversing PPI lead.
Time Horizon & Aggregation:
- Time Horizon: Cyclical (months) because production chain imbalances typically take quarters to normalize.
- Aggregation Weight Hint: High, given the extreme z-score deviation and rising underlying CPI.
Macro Relevance:
- Informs the pricing and inflation dimension by identifying pipeline cost shocks.
- The economic mechanism implies margin compression for downstream firms or a secondary wave of consumer inflation (1).
- Cycle position: Not determined by this methodology.
- Typically interacts with inflation breakevens and unit labor costs to confirm broad-based regime shifts.
Regime Context:
- The regime is newly entered (April 2026) and persistent, currently in its second month of duration.
- The direction of change is strengthening, with the divergence z-score rising from 1.07 to 1.64 (1).
Model Limitations:
- PPI is subject to multi-month revisions which may shift historical z-score calculations (1).
- Seasonal factor updates can alter the perceived strength of the divergence trend (1).
Data & References:
- CPI vs PPI Divergence Signal (2026-05-31) (1).
- Divergence z-score (1.64) and PPI YoY (13.07%) are the most influential data points.
- ISM Prices Paid and Unit Labor Costs would improve reliability of the pass-through assessment.
CPI vs PPI Divergence Chart
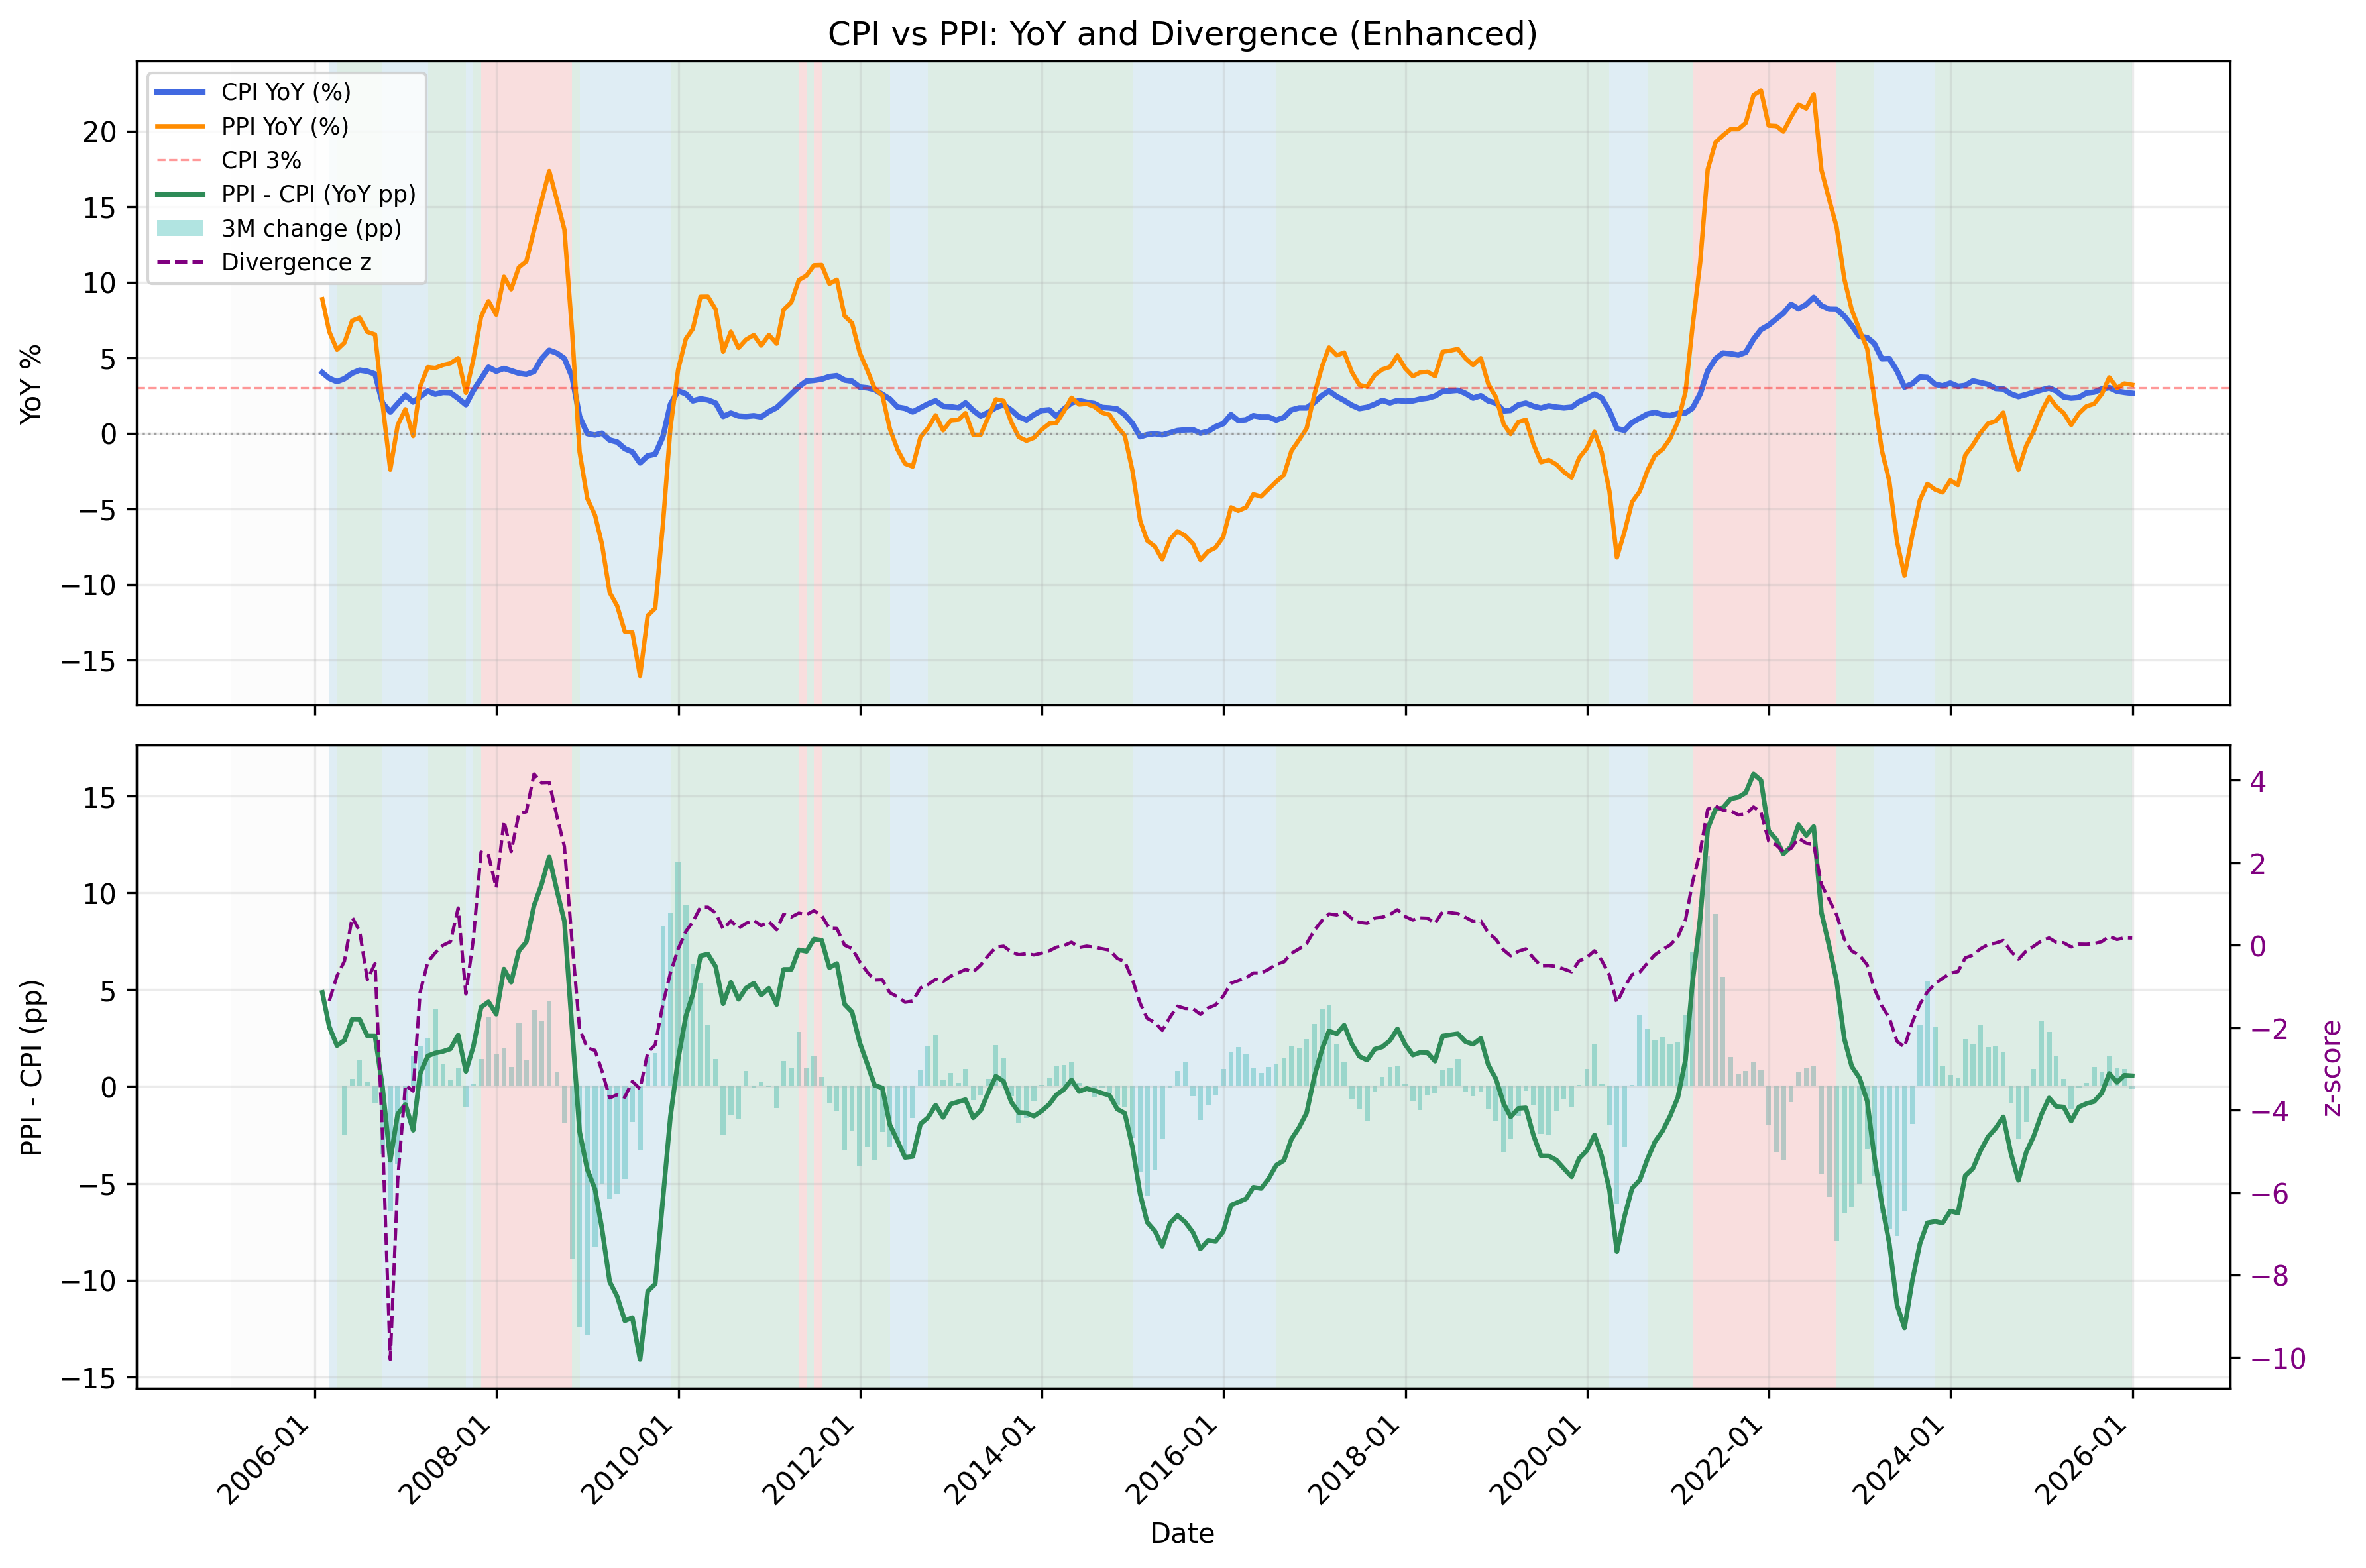
Divergence between consumer and producer inflation.
CPI vs PPI Signal Table▸
The information on this website is provided for general informational and educational purposes only and does not constitute financial, investment, legal, or tax advice. It does not take into account any individual objectives, financial situation, or needs.
All views expressed are personal, based on publicly available information, and do not represent the views of any employer or reflect any proprietary or internal analysis. This information should not be relied upon for making investment decisions.
No representation or warranty is made as to the accuracy, completeness, or timeliness of the information, and no liability is accepted for any loss arising directly or indirectly from its use.
All views expressed are personal, based on publicly available information, and do not represent the views of any employer or reflect any proprietary or internal analysis. This information should not be relied upon for making investment decisions.
No representation or warranty is made as to the accuracy, completeness, or timeliness of the information, and no liability is accepted for any loss arising directly or indirectly from its use.