Labor Market Tightness Signal
Labor market tightness signal: tracking the balance between labour demand and supply.
Gemini Summary
Signal Summary:
- Configuration statement: Given a Quits Rate of 2.0, Layoffs of 1.1, and an Openings Rate of 4.0, this setup aligns with Range-biased price paths and Normal volatility, where the dominant risk is Mean reversion, not Trend continuation (1).
- The signal currently occupies a NEUTRAL regime, indicating a balanced labor market where supply and demand for workers are roughly aligned (1).
- Conviction Band: Medium; Interpretation Confidence: High Confidence; Internal Conflict Flag: No. Signal Stability Assessment: Stable; Threshold Proximity: Moderate; Revision Sensitivity: Unknown.
Methodology Applied:
- Composite z-scores between -0.75 and +0.75 are classified as NEUTRAL, implying stable wage growth and a neutral policy environment (1).
- The composite is driven by the Quits minus Layoffs spread (~60% weight) and the Job Openings rate (~40% weight) (1).
- Rising values in the composite signal expansionary or inflationary regimes, while falling values suggest disinflation or slowdown (1).
- BLS Labor Market Tightness data (2025-12-01).
Key Dynamics:
- The primary driver is the stabilization of the Quits rate (2.0) alongside a moderate Layoffs rate (1.1), maintaining a balanced tightness spread of 0.9 (1).
- Momentum shows slight demand cooling as Openings momentum is negative (-0.3 over 3 months), but this is offset by neutral-to-improving turnover flows (1).
- Conditional Invalidation: A move in the composite z-score (currently -0.267) beyond +/- 0.75 would trigger a regime shift (1).
Scenario Balance:
- Base case dominant: Continued NEUTRAL regime as quits and openings remain range-bound.
- Upside risk: Tightening labor scarcity triggered by a sharp rise in quits (employee confidence) above 2.2.
- Downside risk: Shift to COOL regime triggered by layoffs rising above 1.5 or openings falling below 4.0.
Time Horizon & Aggregation:
- Time Horizon: Cyclical (months), reflecting the persistence of employment trends and JOLTS reporting frequencies (1).
- Aggregation Weight Hint: Medium, as labor tightness is a key leading indicator for wage-push inflation but is subject to reporting lags (1).
Macro Relevance:
- Informs the Inflation and US Labour Market dimensions by assessing the balance of power between employers and employees (1).
- Economic mechanism: Directional stability implies balanced bargaining power, mitigating risks of a wage-price spiral (1).
- Cycle position: Not determined.
- Interacts with ECI wage growth and PCE/CPI inflation signals to validate inflationary pressure (1).
Regime Context:
- Persistence: The signal has remained in the NEUTRAL regime for 13 consecutive months since December 2024 (1).
- Direction of change: Stabilising, with the LMT_Composite_z moving toward zero from previous lower levels (1).
Model Limitations:
- Subject to significant BLS revisions and monthly reporting lags (1).
- Potential for survey-based noise in the job openings and quits metrics (1).
Data & References:
Labor Market Tightness Chart
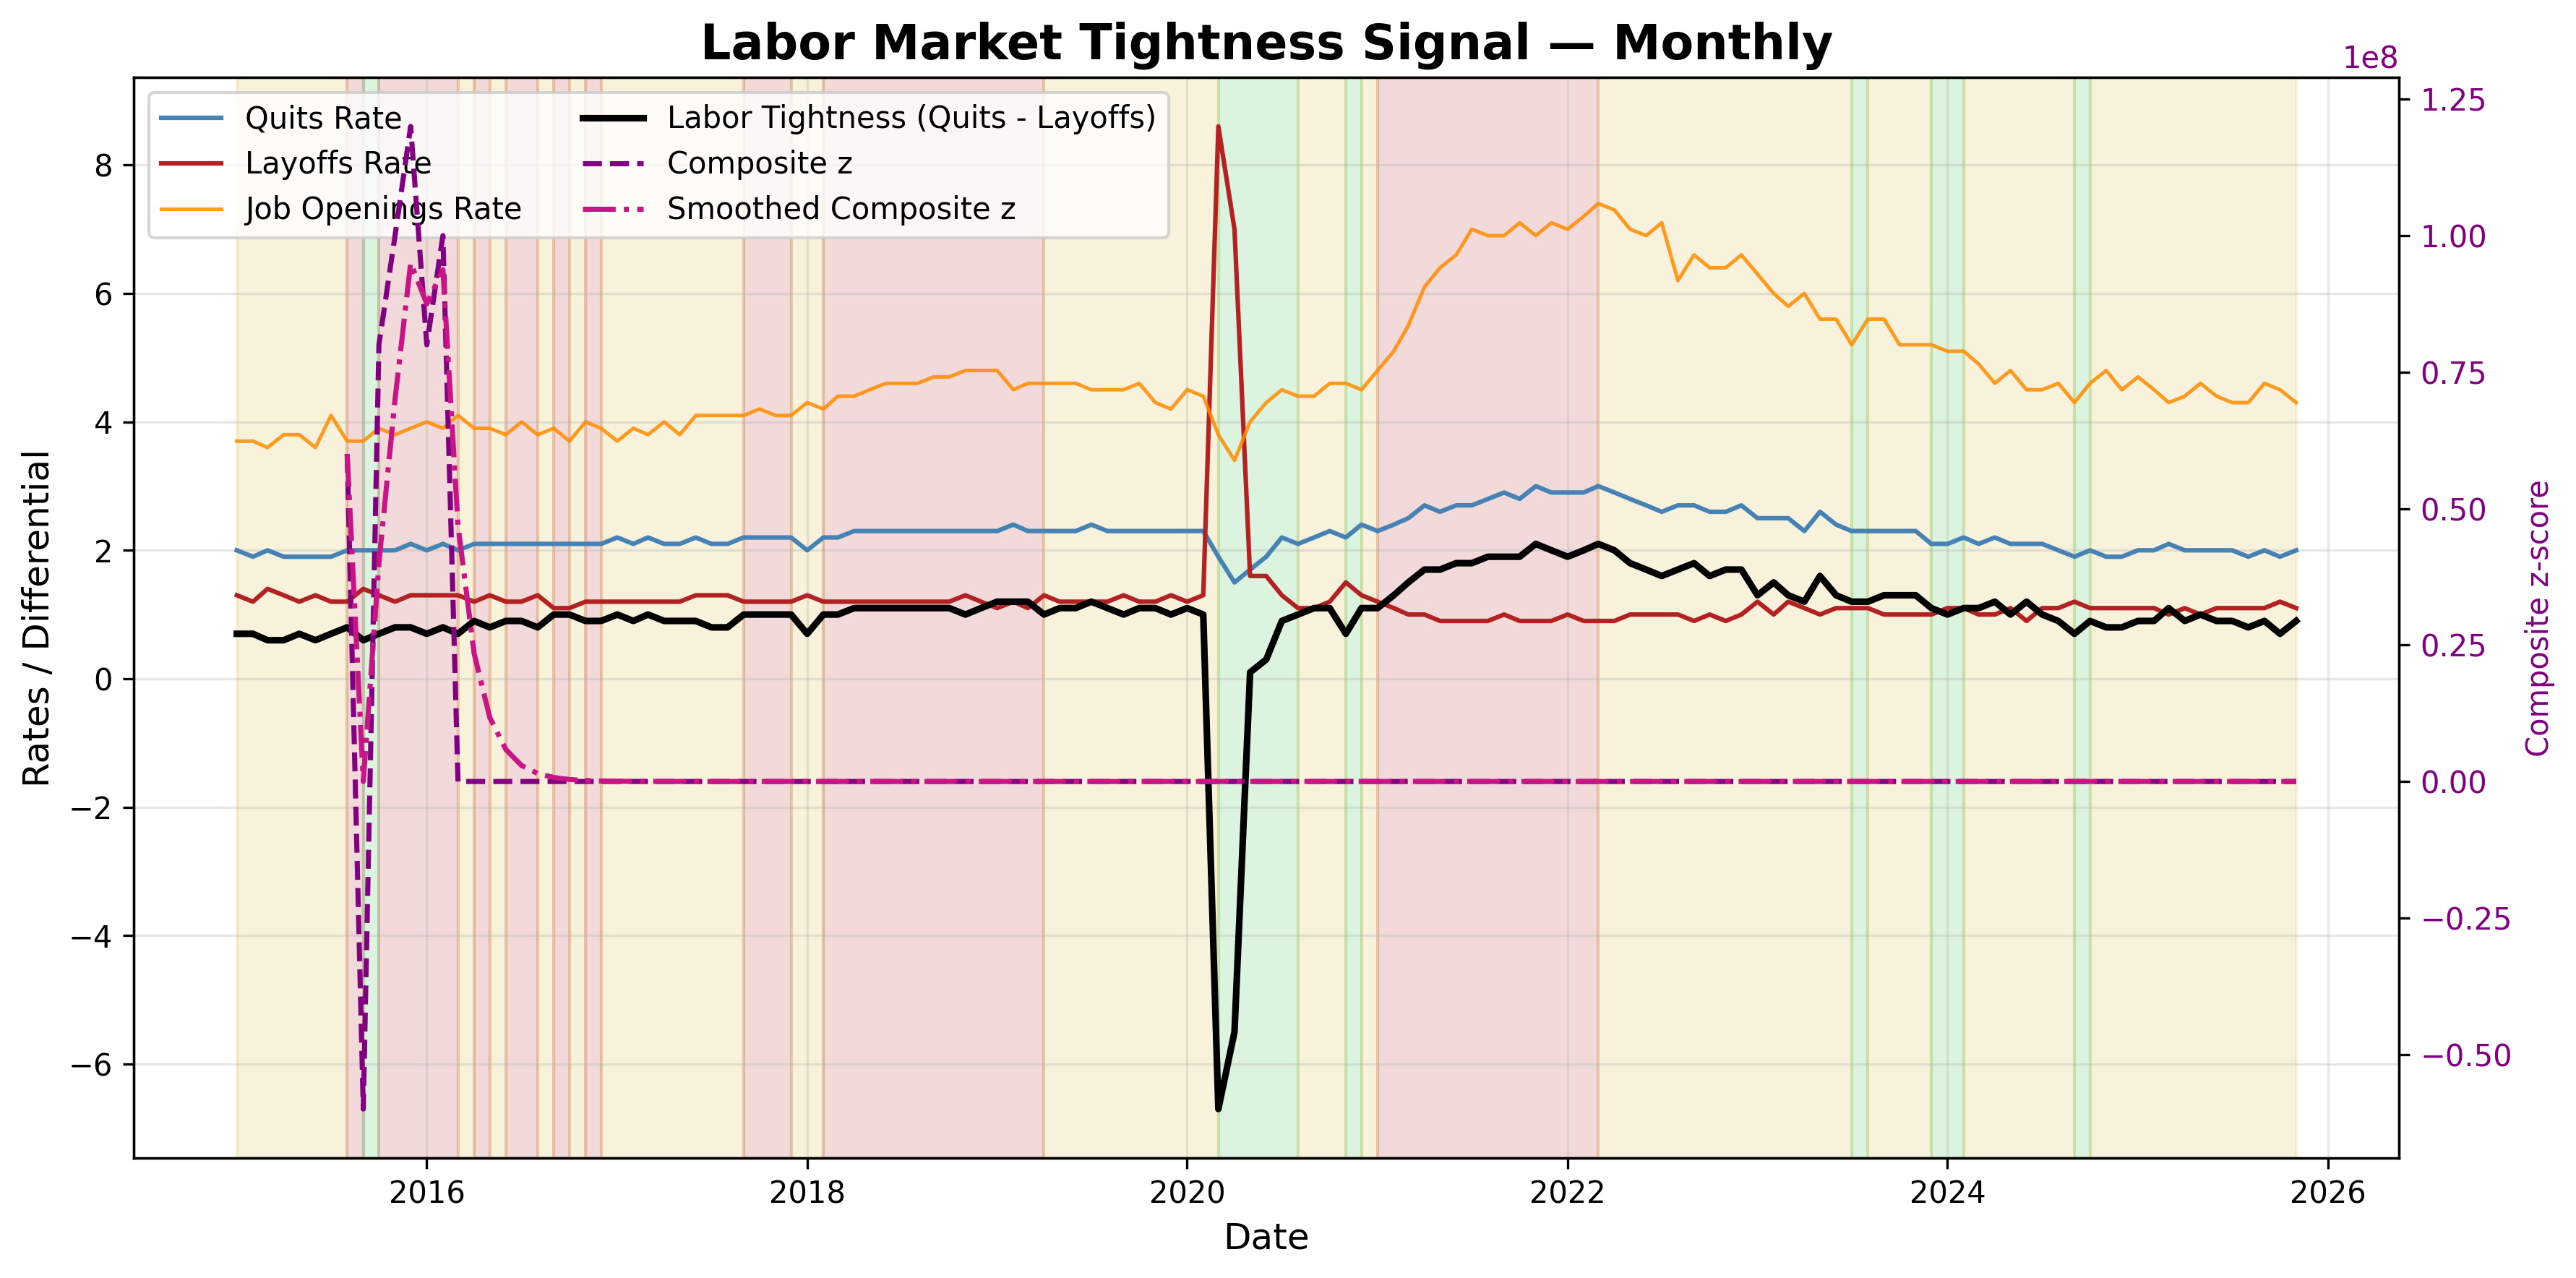
Labor market tightness: diagnostic of demand vs supply conditions.
Labor Market Tightness Table▸
The information presented is for general informational purposes only and does not constitute financial or investment advice. It has been prepared without regard to individual objectives, financial situation, or needs. You should consider whether it is appropriate for your circumstances and seek independent advice where necessary.