Employment Composition Signal
Employment composition signal: tracking shifts across key sectors and categories in the labour market.
Gemini Summary
Signal Summary:
- The Employment Composition signal (1) indicates a NEUTRAL state for the U.S. labor market as of 2025-12-01, with the composite z-score at -0.62.
- This reflects a stable period with neither significant tightness nor rising slack.
- Conviction Band: High | Interpretation Confidence: High Confidence | Internal Conflict Flag: No.
Key Dynamics:
- The neutral state is driven by a stable participation rate (62.4%), employment-population ratio (59.7%), and unemployment rate (4.4%) as of 2025-12-01 (1).
- Three-month momentum for these key metrics shows largely stable conditions (participation -0.1, emp-pop 0.0, unemployment 0.0) (1).
- No internal offsets or tensions are observed, supporting the neutral classification.
- Conditional Invalidation: The signal would reverse if the composite Employment Composition z-score moves outside the -0.75 to +0.75 range, shifting the regime to HOT or COOL (1).
Scenario Balance:
- Base Case dominant: Continued neutral labor market conditions, supported by current stability in participation, employment, and unemployment rates.
- Most plausible upside risk and trigger: An increase in participation or employment-population ratio, or a decrease in unemployment, leading to a HOT regime (z-score > +0.75).
- Most plausible downside risk and trigger: A decrease in participation or employment-population ratio, or an increase in unemployment, leading to a COOL regime (z-score < -0.75).
Time Horizon & Aggregation:
- Time Horizon: Cyclical (months) – reflects monthly changes and 3-month momentum, typical for labor market cycles.
- Aggregation Weight Hint: High – provides a robust and coherent view of labor market health, a critical macro input.
Macro Relevance:
- This signal primarily informs the macro dimension of slack, indicating the degree of tightness or looseness in the labor market (1).
- The current neutral state suggests a mid-cycle position where labor market dynamics are balanced.
- It typically interacts with other macro signals by cross-validating insights on wage growth (2), overall inflation (3), and broad economic growth trends (4).
Data & References:
- U.S. Bureau of Labor Statistics (BLS) Current Population Survey (CPS) data for participation rate, employment-population ratio, and unemployment rate, latest observation 2025-12-01.
- The `Employment_Regime` (NEUTRAL) and `Employment_Composition_z` (-0.622590) are most influential for the current state (1).
- The Wage Growth and Inflation Signal (2) and Federal Reserve Liquidity Composite Signal (5) would improve depth and reliability.
Employment Composition Signal Chart
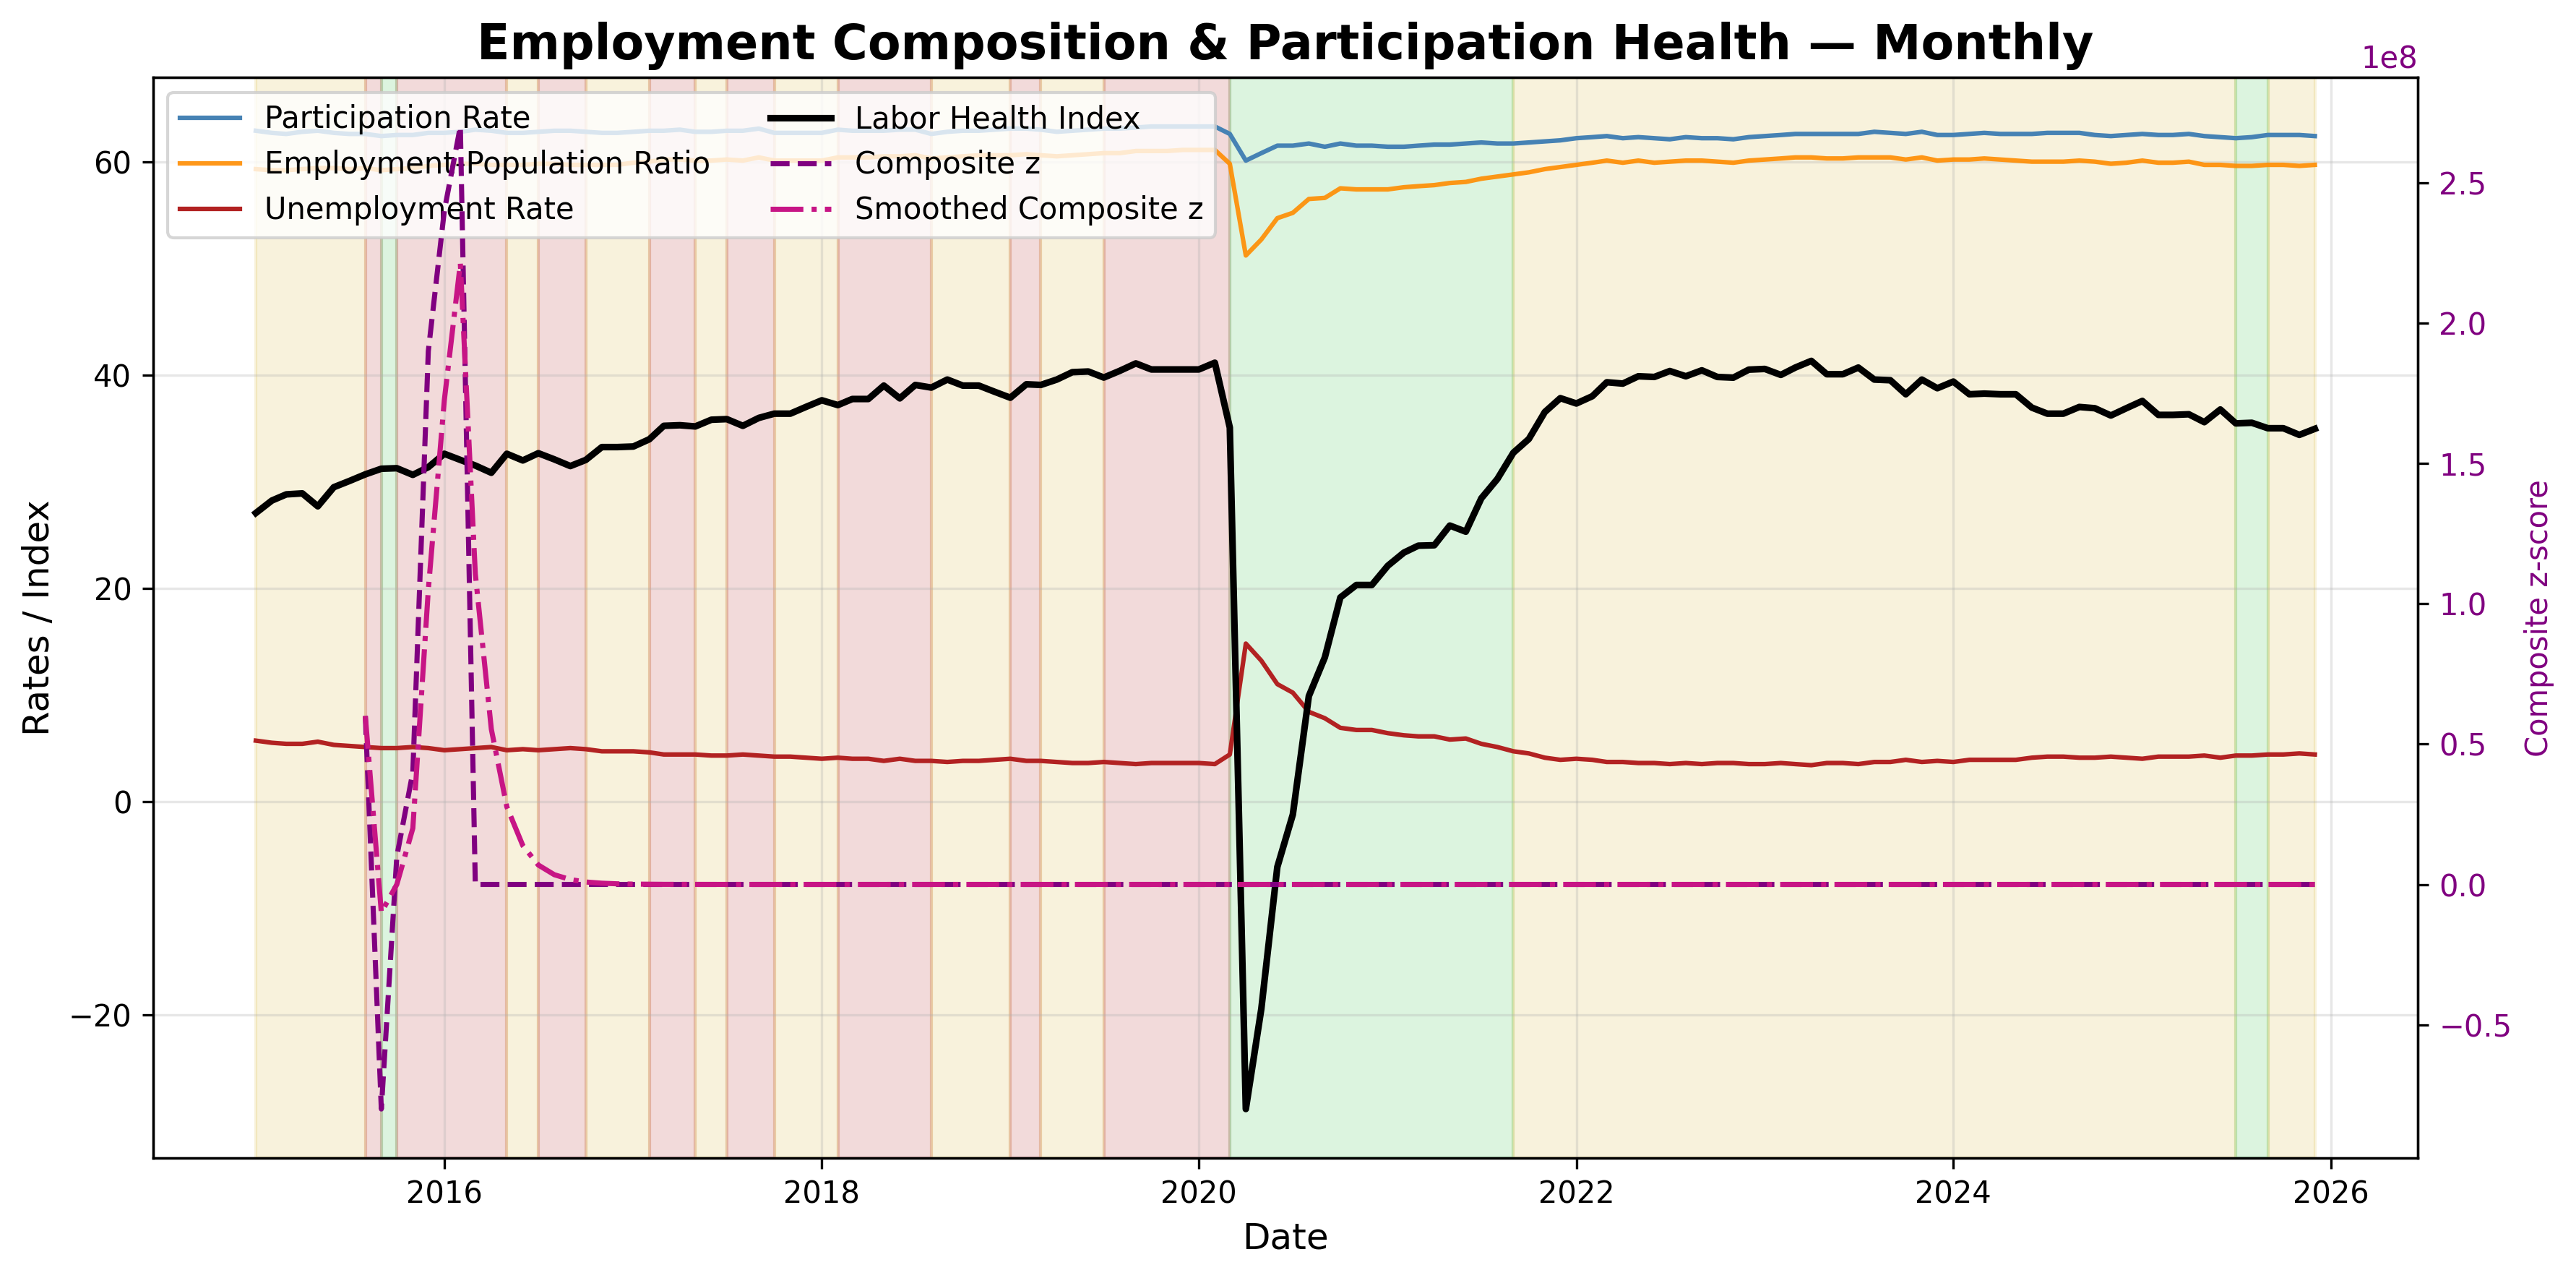
Employment composition: distribution and momentum across labour market segments.
Employment Composition Signal Table▸
The information presented is for general informational purposes only and does not constitute financial or investment advice. It has been prepared without regard to individual objectives, financial situation, or needs. You should consider whether it is appropriate for your circumstances and seek independent advice where necessary.