Yield Curve Slope Signal
Yield curve slope signal: tracking recession risk and monetary stance via curve shape.
Gemini Summary
Signal Summary:
- Configuration statement: Given a YC_Composite of 0.51 derived from positive T10Y2Y and T10Y3M z-scores, this setup aligns with Range-biased price paths and Compressed volatility, where the dominant risk is Mean reversion, not Trend continuation. (1)
- The signal currently occupies a Flat/Neutral regime, reflecting a transition phase or stable policy environment (1).
- Conviction Band: Medium; Interpretation Confidence: High Confidence; Internal Conflict Flag: No. Signal Stability Assessment: Stable; Threshold Proximity: Moderate; Revision Sensitivity: Unknown.
Methodology Applied:
- Regime classification: Values between -0.75 and 0.75 are defined as Flat/Neutral, indicating stable policy (1).
- Composite Construction: The signal averages robust z-scores of the 10Y-2Y and 10Y-3M Treasury spreads (1).
- Hysteresis Rule: Exit from a regime requires crossing a +/- 0.50 threshold for two consecutive months (1).
- Yield Curve Slope Signal dataset ending 2026-06-30 (1).
Key Dynamics:
- The primary driver is the stabilization of both the T10Y2Y (0.38) and T10Y3M (0.64) spreads within positive territory (1).
- The YC_Composite (0.51) shows stabilization after failing to breach the 0.75 Steepening threshold in early 2026 (1).
- Conditional Invalidation: A move in the YC_Composite above 0.75 or below -0.75 would trigger a regime shift (1).
- Persistence is high, as the neutral regime has been maintained since August 2024 (1).
Scenario Balance:
- Dominant base case: Continued policy stability and neutral asset allocation as the composite remains centered (1).
- Upside risk: A shift to "Steepening" (Z > 0.75) triggered by rising term premiums or expansionary growth expectations (1).
- Downside risk: A return to "Inversion" (Z < -0.75) triggered by restrictive monetary policy or heightened recession fears (1).
Time Horizon & Aggregation:
- Time Horizon: Cyclical (months); methodology notes lead times of 2-6 quarters for recession signals (1).
- Aggregation Weight Hint: Medium; though central to macro, the neutral reading suggests limited immediate directional impulse (1).
Macro Relevance:
- The signal informs market expectations of future monetary policy and term risk compensation (1).
- Economic mechanism: The transition to neutral suggests an easing of the restrictive pressures typical of an inverted curve (1).
- Cycle position: Not determined.
Regime Context:
- The current Flat/Neutral regime is persistent, having been entered in late 2024 (1).
- The recent direction reflects a stabilising trend following a peak in the composite in January 2026 (1).
Model Limitations:
- Structural distortions from QE/QT and liquidity-driven noise at inflection points (1).
- Signal confidence is reduced if T10Y2Y and T10Y3M spreads diverge significantly (1).
Data & References:
Yield Curve Slope Chart
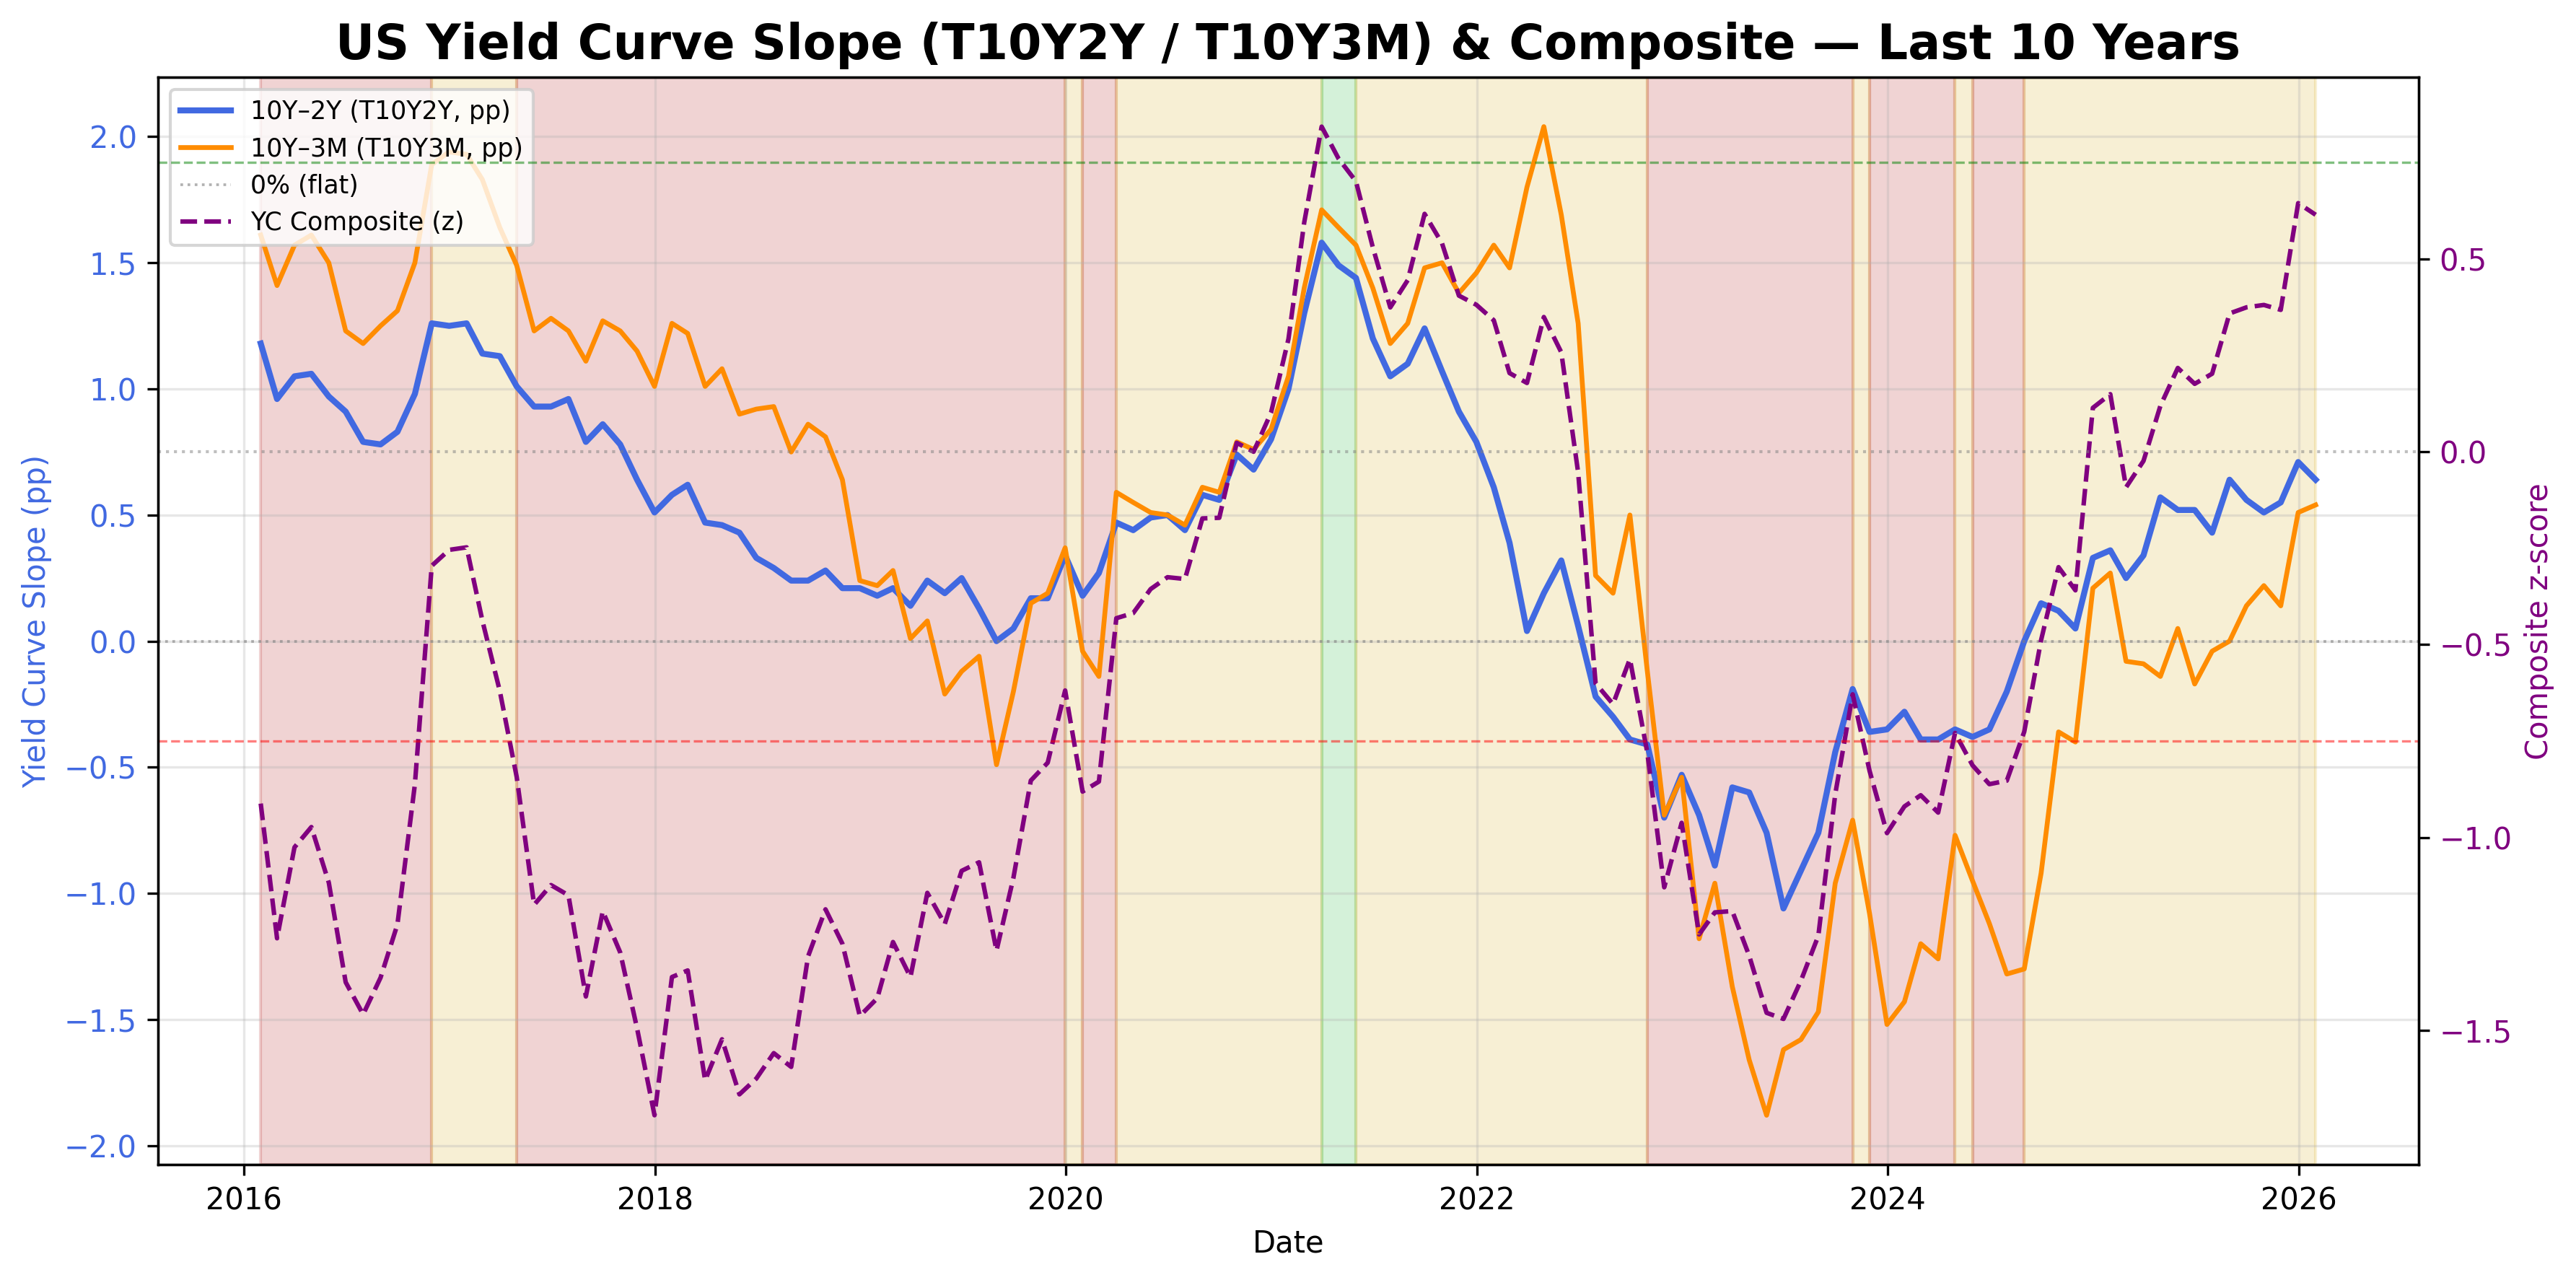
U.S. yield curve slope across 10Y-2Y and 10Y-3M indicators.
Yield Curve Slope Table▸
The information on this website is provided for general informational and educational purposes only and does not constitute financial, investment, legal, or tax advice. It does not take into account any individual objectives, financial situation, or needs.
All views expressed are personal, based on publicly available information, and do not represent the views of any employer or reflect any proprietary or internal analysis. This information should not be relied upon for making investment decisions.
No representation or warranty is made as to the accuracy, completeness, or timeliness of the information, and no liability is accepted for any loss arising directly or indirectly from its use.
All views expressed are personal, based on publicly available information, and do not represent the views of any employer or reflect any proprietary or internal analysis. This information should not be relied upon for making investment decisions.
No representation or warranty is made as to the accuracy, completeness, or timeliness of the information, and no liability is accepted for any loss arising directly or indirectly from its use.