U.S. Treasury Yield Curve Signal
U.S. Treasury curve shape as an indicator of growth and policy stance.
Gemini Summary
Signal Summary:
- Configuration statement: Given a Yield Spread of 0.30% exceeding its 3-month Trend of -0.023%, this setup aligns with Downward-biased price paths and Normal volatility, where the dominant risk is Regime shift, not Trend continuation. (1)
- The signal is currently in a Bearish regime, reflecting a shift away from the prior Bullish/Inversion state. (1)
- Conviction Band: Medium; Interpretation Confidence: High Confidence; Internal Conflict Flag: No. Signal Stability Assessment: Improving; Threshold Proximity: Moderate; Revision Sensitivity: Moderate. (1)
Methodology Applied:
- A Bearish regime is triggered when the Yield Spread (GS10 - FEDFUNDS) exceeds 1.5% or moves above its 3-month Trend. (1)
- A Bullish regime (recession risk) is defined by a Yield Spread at or below 0%. (1)
- Economic interpretation: Measures the gap between long-term growth/inflation expectations and monetary policy tightness. (1)
- U.S. Treasury Yield Curve Signal dataset, latest observation: 2026-01-01. (1)
Key Dynamics:
- The primary driver is the positive Yield Spread (0.30%) maintaining position above the declining 3-month Trend. (1)
- The signal shows stabilisation in Bearish territory after three consecutive months of non-inverted readings. (1)
- Conditional Invalidation: The spread falling below 0% or dropping back below the 3-month moving average trend. (1)
- Persistence is noted as the regime successfully transitioned from a volatile 2025 mid-year period to a sustained Bearish stance. (1)
Scenario Balance:
- Dominant base case: Continued Bearish regime as long as long-term yields remain above the Fed Funds Rate.
- Upside risk: A sharp steepening toward the 1.5% threshold triggered by rising inflation expectations or term premia.
- Downside risk: Re-inversion (Bullish flip) if policy tightness (FEDFUNDS) overwhelms growth expectations (GS10).
Time Horizon & Aggregation:
- Time Horizon: Cyclical (months) based on the 3-month trend logic and the 6-18 month lead time for recession risks. (1)
- Aggregation Weight Hint: High; the yield curve is a foundational macro anchor for cross-asset risk-on/risk-off regimes.
Macro Relevance:
- Informs the pricing and liquidity dimension by assessing the restrictiveness of current monetary policy. (1)
- Mechanism: Current steepening implies early-cycle expansion or rising term premia, favouring risk-on/cyclical exposure. (1)
- Cycle position: Not determined.
Regime Context:
- Newly persistent regime; the signal has maintained a Bearish classification for three months since November 2025. (1)
- Direction of change: Stabilising in a Bearish (cyclical expansionary) state. (1)
Model Limitations:
- Lagging indicator with a 6-18 month window; conflates policy expectations with term premia. (1)
- Revision window cannot be assessed from provided content.
Data & References:
U.S. Treasury Yield Curve Chart
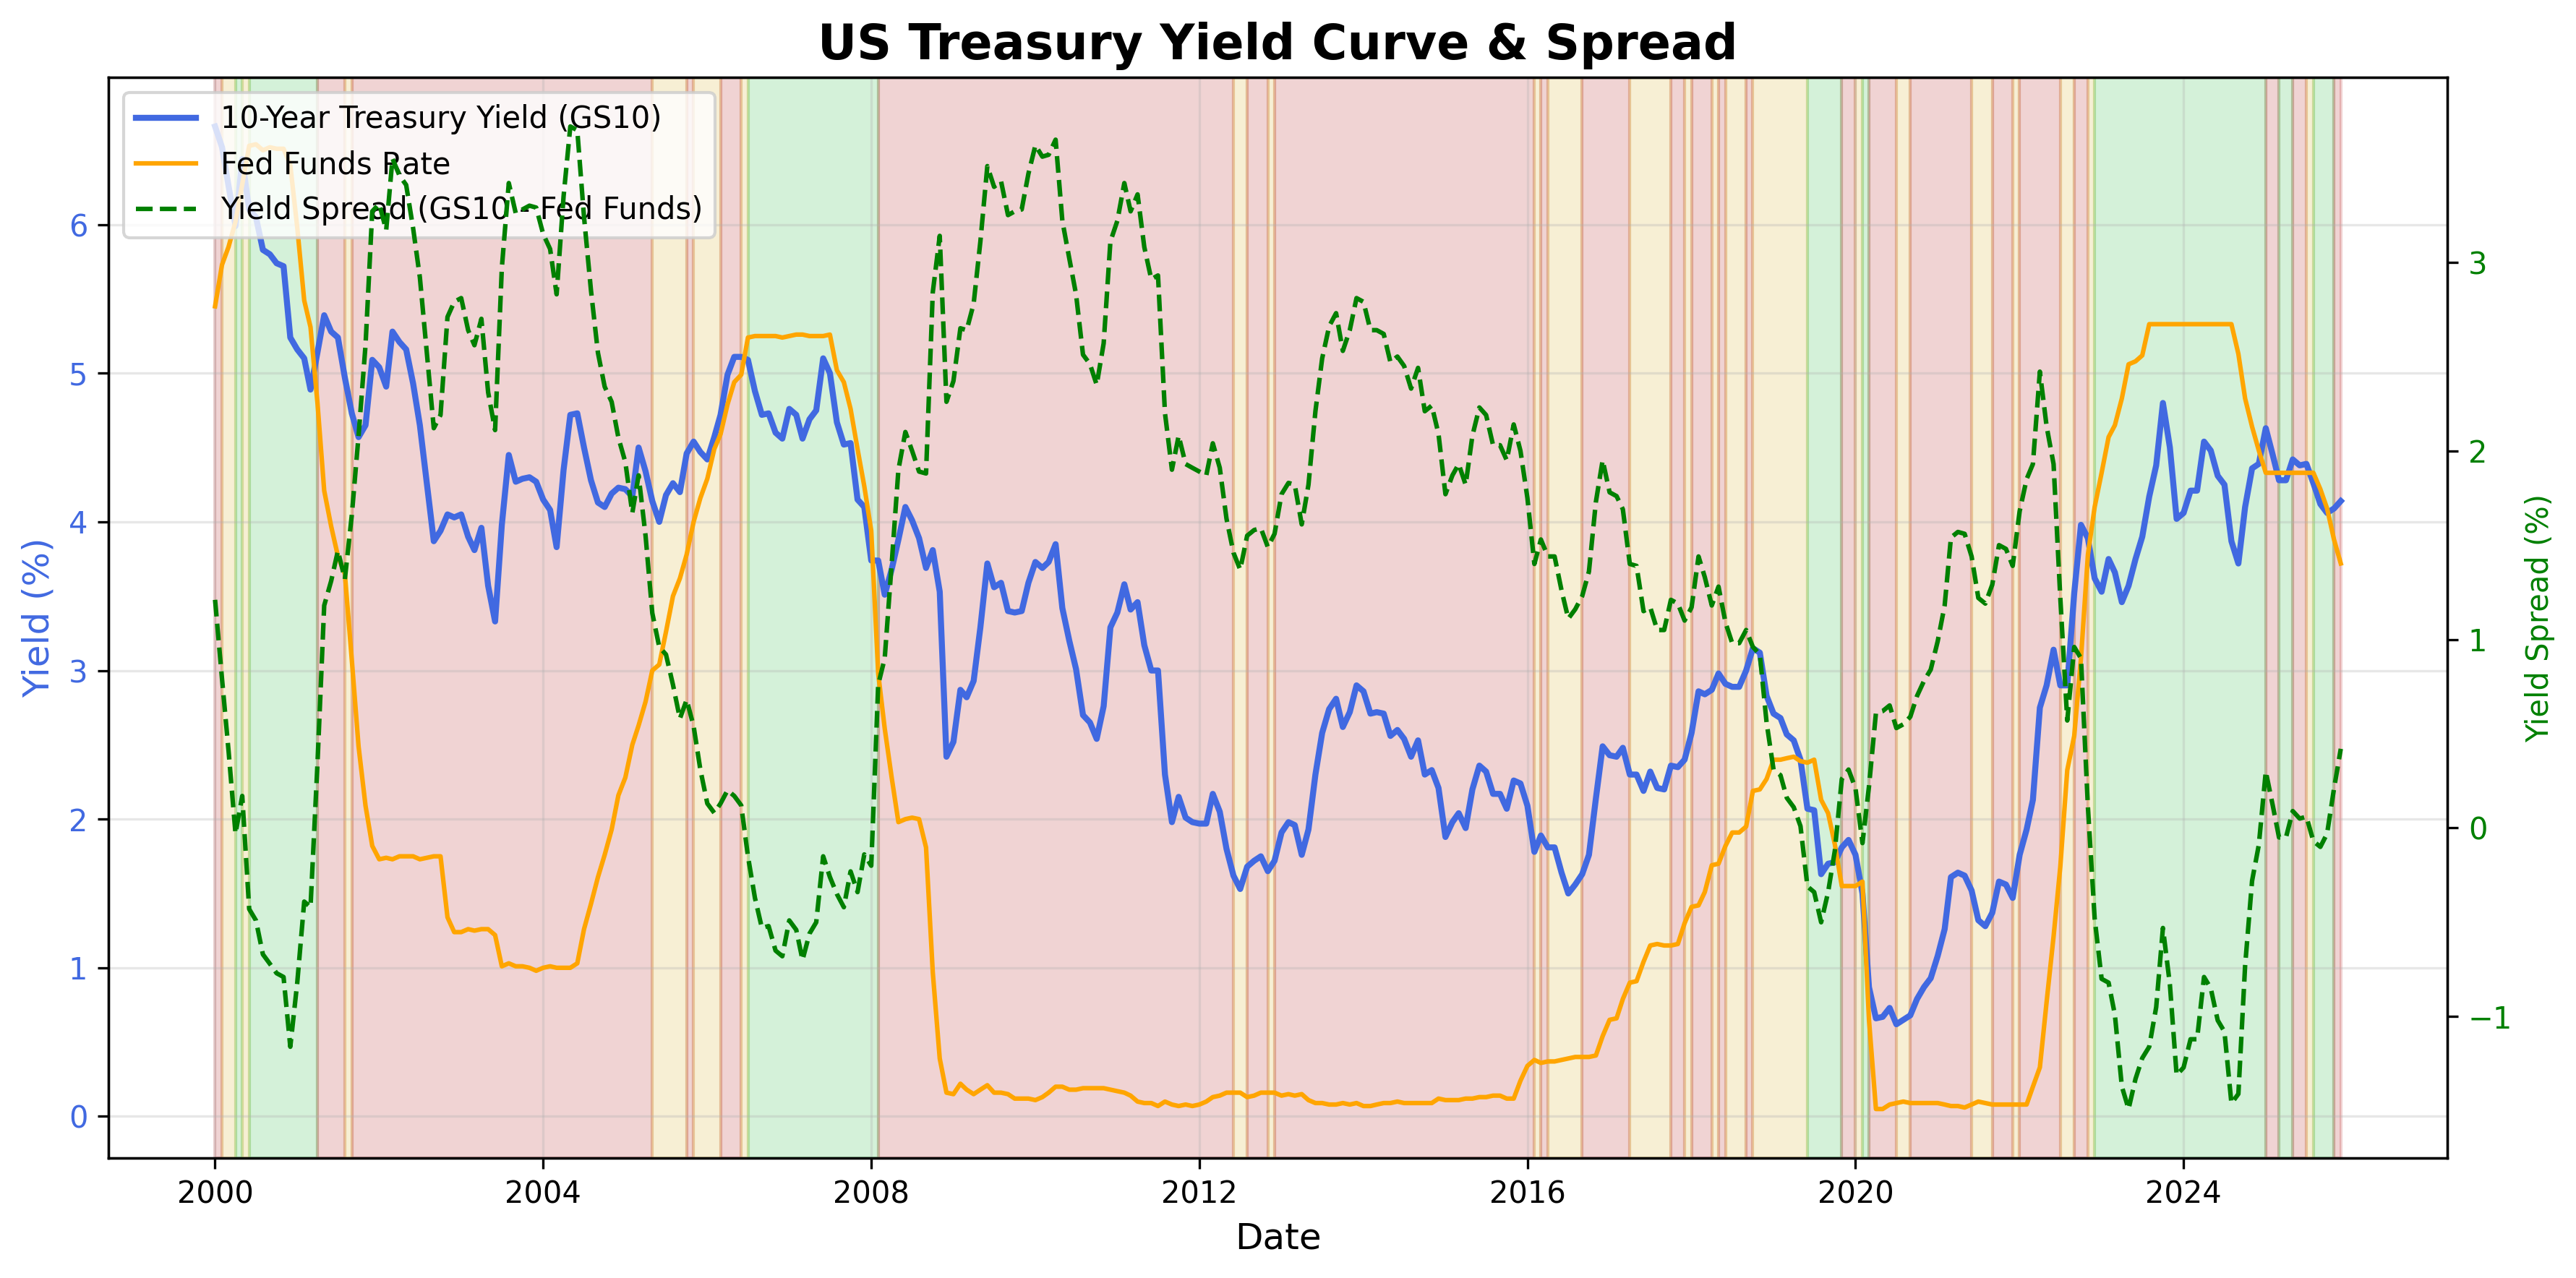
Treasury yield curve across maturities.
Treasury Yield Curve Table▸
The information on this website is provided for general informational and educational purposes only and does not constitute financial, investment, legal, or tax advice. It does not take into account any individual objectives, financial situation, or needs.
All views expressed are personal, based on publicly available information, and do not represent the views of any employer or reflect any proprietary or internal analysis. This information should not be relied upon for making investment decisions.
No representation or warranty is made as to the accuracy, completeness, or timeliness of the information, and no liability is accepted for any loss arising directly or indirectly from its use.
All views expressed are personal, based on publicly available information, and do not represent the views of any employer or reflect any proprietary or internal analysis. This information should not be relied upon for making investment decisions.
No representation or warranty is made as to the accuracy, completeness, or timeliness of the information, and no liability is accepted for any loss arising directly or indirectly from its use.