USD Index Signal
USD Index signal: tracking the strength of the US Dollar against major currencies.
Gemini Summary
Signal Summary:
- Configuration statement: Given the USD Index value of 119.51 remains below its 12-month moving average of 119.84 with a negligible 6-month momentum of -0.20%, this setup aligns with Downward-biased price paths and Compressed volatility, where the dominant risk is Mean reversion, not Trend continuation (1).
- The signal is currently classified as Bearish, representing a persistent but weakening downward regime over the last three months (1).
- Conviction Band: Low; Interpretation Confidence: Low Confidence; Internal Conflict Flag: Yes. Signal Stability Assessment: Deteriorating; Threshold Proximity: Near; Revision Sensitivity: Moderate.
Methodology Applied:
- A Weakening USD regime is defined by a 6-month change below -5% and a price below the 12-month MA (1).
- Regime transitions or lack of conviction are identified when momentum and price levels conflict or stay within hysteresis bands (1).
- USD Index Signal: Latest observation 2026-06-01 (1).
Key Dynamics:
- The primary driver is the index trading below its 12-month MA, though the 6-month change (-0.20%) lacks the -5% threshold required for reinforcing momentum (1).
- Price is currently stabilizing near the moving average, suggesting a loss of bearish momentum compared to 2025 levels (1).
- Internal tension exists between the Bearish classification and the near-zero momentum value.
- Conditional Invalidation: A price close above 120.44 (MA + 0.5% hysteresis) would trigger a Neutral or Bullish shift (1).
Scenario Balance:
- Dominant base case: Continued dollar weakness as long as price remains capped by the 12-month MA.
- Most plausible upside risk: Mean reversion toward the MA triggered by narrowing interest rate differentials.
- Most plausible downside risk: Momentum acceleration if the 6-month change breaches the -5% threshold.
Time Horizon & Aggregation:
- Time Horizon: Cyclical (months) based on the 12-month MA and 6-month momentum windows (1).
- Aggregation Weight Hint: Low, due to the proximity of the price to the MA and the lack of momentum conviction.
Macro Relevance:
- Informs global liquidity and financial conditions (1).
- The weakening direction implies easing financial conditions and potential tailwinds for non-USD assets (1).
- Cycle position: Not determined.
- Typically confirms risk-on sentiment when aligned with narrowing credit spreads.
Regime Context:
- The signal entered a Bearish regime in April 2026 and has persisted for three months.
- Direction of change: Stabilizing (the gap between price and MA is narrowing).
Model Limitations:
- Lagging nature due to the use of moving averages and multi-month momentum windows (1).
- Susceptibility to end-of-month sampling noise (1).
Data & References:
- Broad Trade-Weighted USD Index: 2026-06-01 (1).
- USD_12Month_MA (119.84) and USD_6Month_Change (-0.20%) are the most influential datapoints.
- Global credit spreads and central bank policy rates would improve reliability.
USD Index Chart
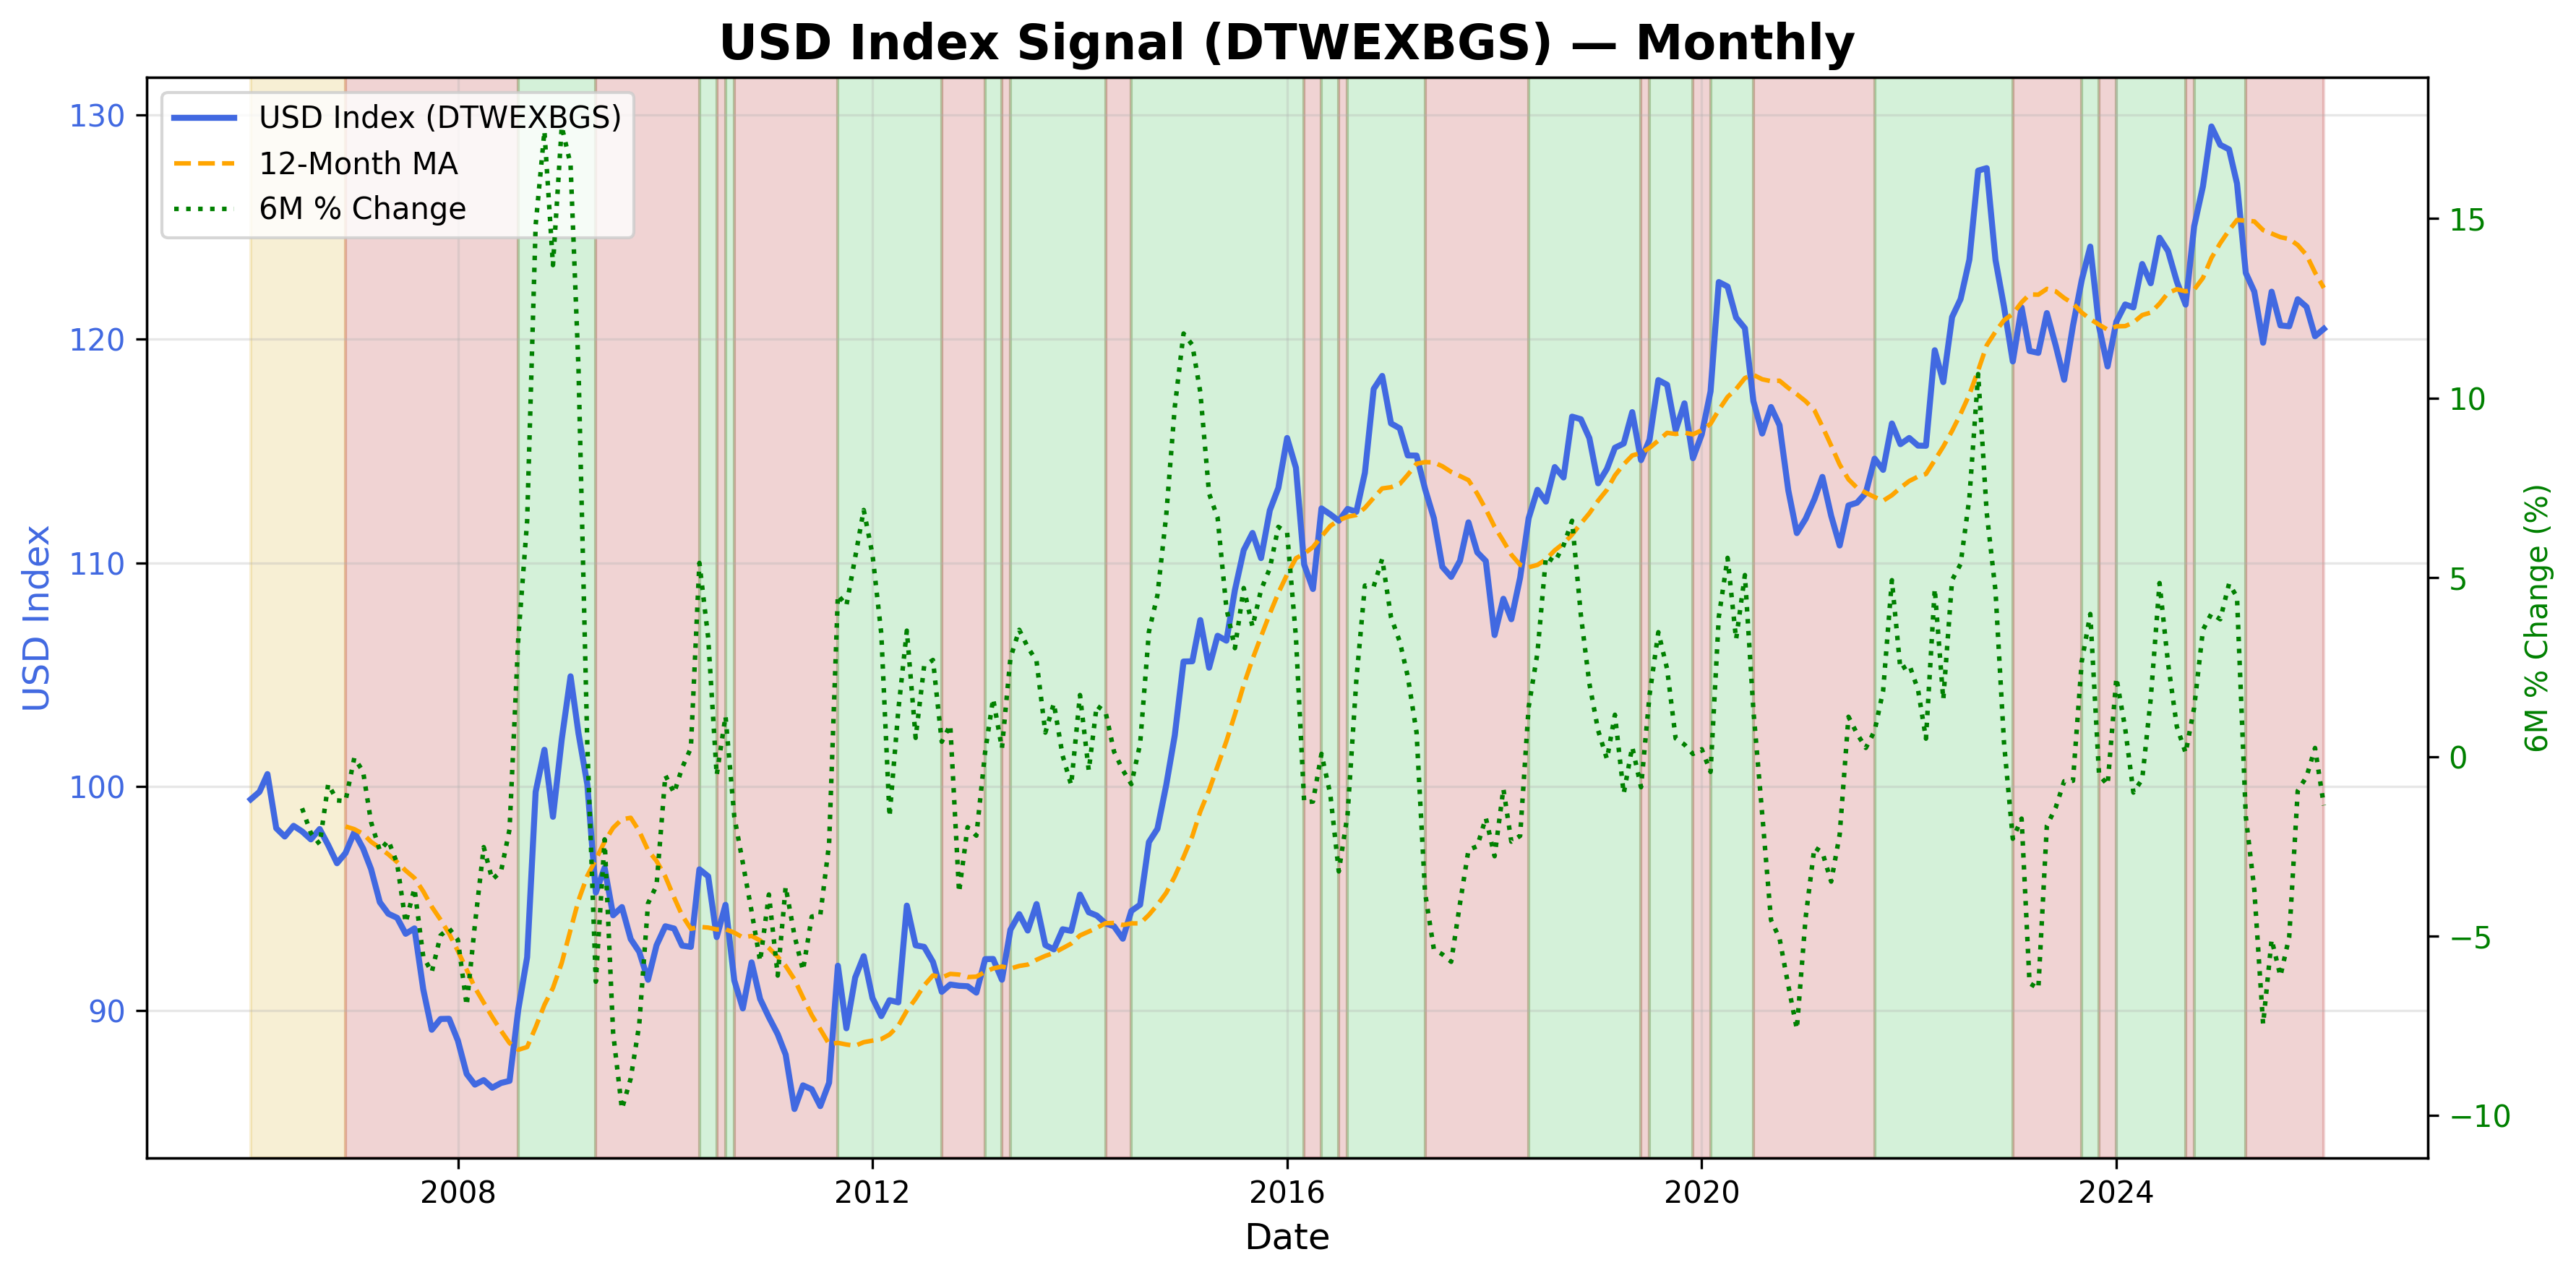
USD Index: tracking the strength of the US Dollar.
USD Index Table▸
The information on this website is provided for general informational and educational purposes only and does not constitute financial, investment, legal, or tax advice. It does not take into account any individual objectives, financial situation, or needs.
All views expressed are personal, based on publicly available information, and do not represent the views of any employer or reflect any proprietary or internal analysis. This information should not be relied upon for making investment decisions.
No representation or warranty is made as to the accuracy, completeness, or timeliness of the information, and no liability is accepted for any loss arising directly or indirectly from its use.
All views expressed are personal, based on publicly available information, and do not represent the views of any employer or reflect any proprietary or internal analysis. This information should not be relied upon for making investment decisions.
No representation or warranty is made as to the accuracy, completeness, or timeliness of the information, and no liability is accepted for any loss arising directly or indirectly from its use.