Squeeze & Exhaustion Risk Indicators
CoT tactical squeeze and exhaustion risk signals.
Gemini Summary
Signal Summary:
- Configuration statement (mandatory): Given a Squeeze_z of 0.12 and an Exhaustion_z of -0.09, this setup aligns with Range-biased price paths and Normal volatility, where the dominant risk is Mean reversion, not Trend continuation. (1)
- The signal has transitioned into a "Normal" regime across both metrics, indicating that systemic positioning stress has dissipated. (1)
- Conviction Band: Medium; Interpretation Confidence: High Confidence; Internal Conflict Flag: No. Signal Stability Assessment: Improving; Threshold Proximity: Far; Revision Sensitivity: Unknown.
Methodology Applied:
- Z-scores < 0.5 (Squeeze_z and Exhaustion_z) signify that tactical risk breadth is within normal historical bounds. (1)
- Exhaustion_z >= 1.0 defines "High Exhaustion Risk," implying systemic trend fatigue and reversal probability. (1)
- Squeeze_z >= 1.0 identifies widespread vulnerability to forced covering of short positions. (1)
- Data Freshness: Fresh. Latest observation date: 2026-06-09. (1)
Key Dynamics:
- The primary driver is the sharp decline in the Exhaustion_z from its peak of 1.06 on 2026-05-26 to current sub-zero levels. (1)
- Momentum indicates stabilization following a period of moderate tactical stress in April and May. (1)
- Conditional Invalidation: Either Z-score rising above 0.5 would signal a return to "Moderate" fragility. (1)
- Persistence Assessment: The current "Normal" state reflects a successful mean reversion from late-cycle fatigue signals observed in late May. (1)
Scenario Balance:
- Base case dominant: Standard market environment where positioning is not a primary driver of price action.
- Upside risk: A sudden spike in Squeeze_z indicating forced covering and flow-driven price spikes.
- Downside risk: A return of Exhaustion_z above 1.0, signaling renewed trend fatigue.
Time Horizon & Aggregation:
- Tactical (weeks): The methodology defines this as a tactical risk overlay for adjusting exposure. (1)
- Aggregation Weight Hint: Medium. While the current regime is stable, the recent "High" stress reading requires continued monitoring of trend health.
Macro Relevance:
- This signal informs the "Positioning and Sentiment" dimension of macro aggregation. (1)
- The economic mechanism is the cooling of systemic trend fatigue, suggesting a more sustainable expansion or a pause in prior trend momentum. (1)
- Cycle position: Not determined.
Regime Context:
- Newly entered "Normal" regime for exhaustion risk following a volatile peak in late May. (1)
- Direction of change: Stabilising.
Model Limitations:
- Ignores sector-specific concentration and assumes static thresholds. (1)
Data & References:
Squeeze & Exhaustion Risk Chart
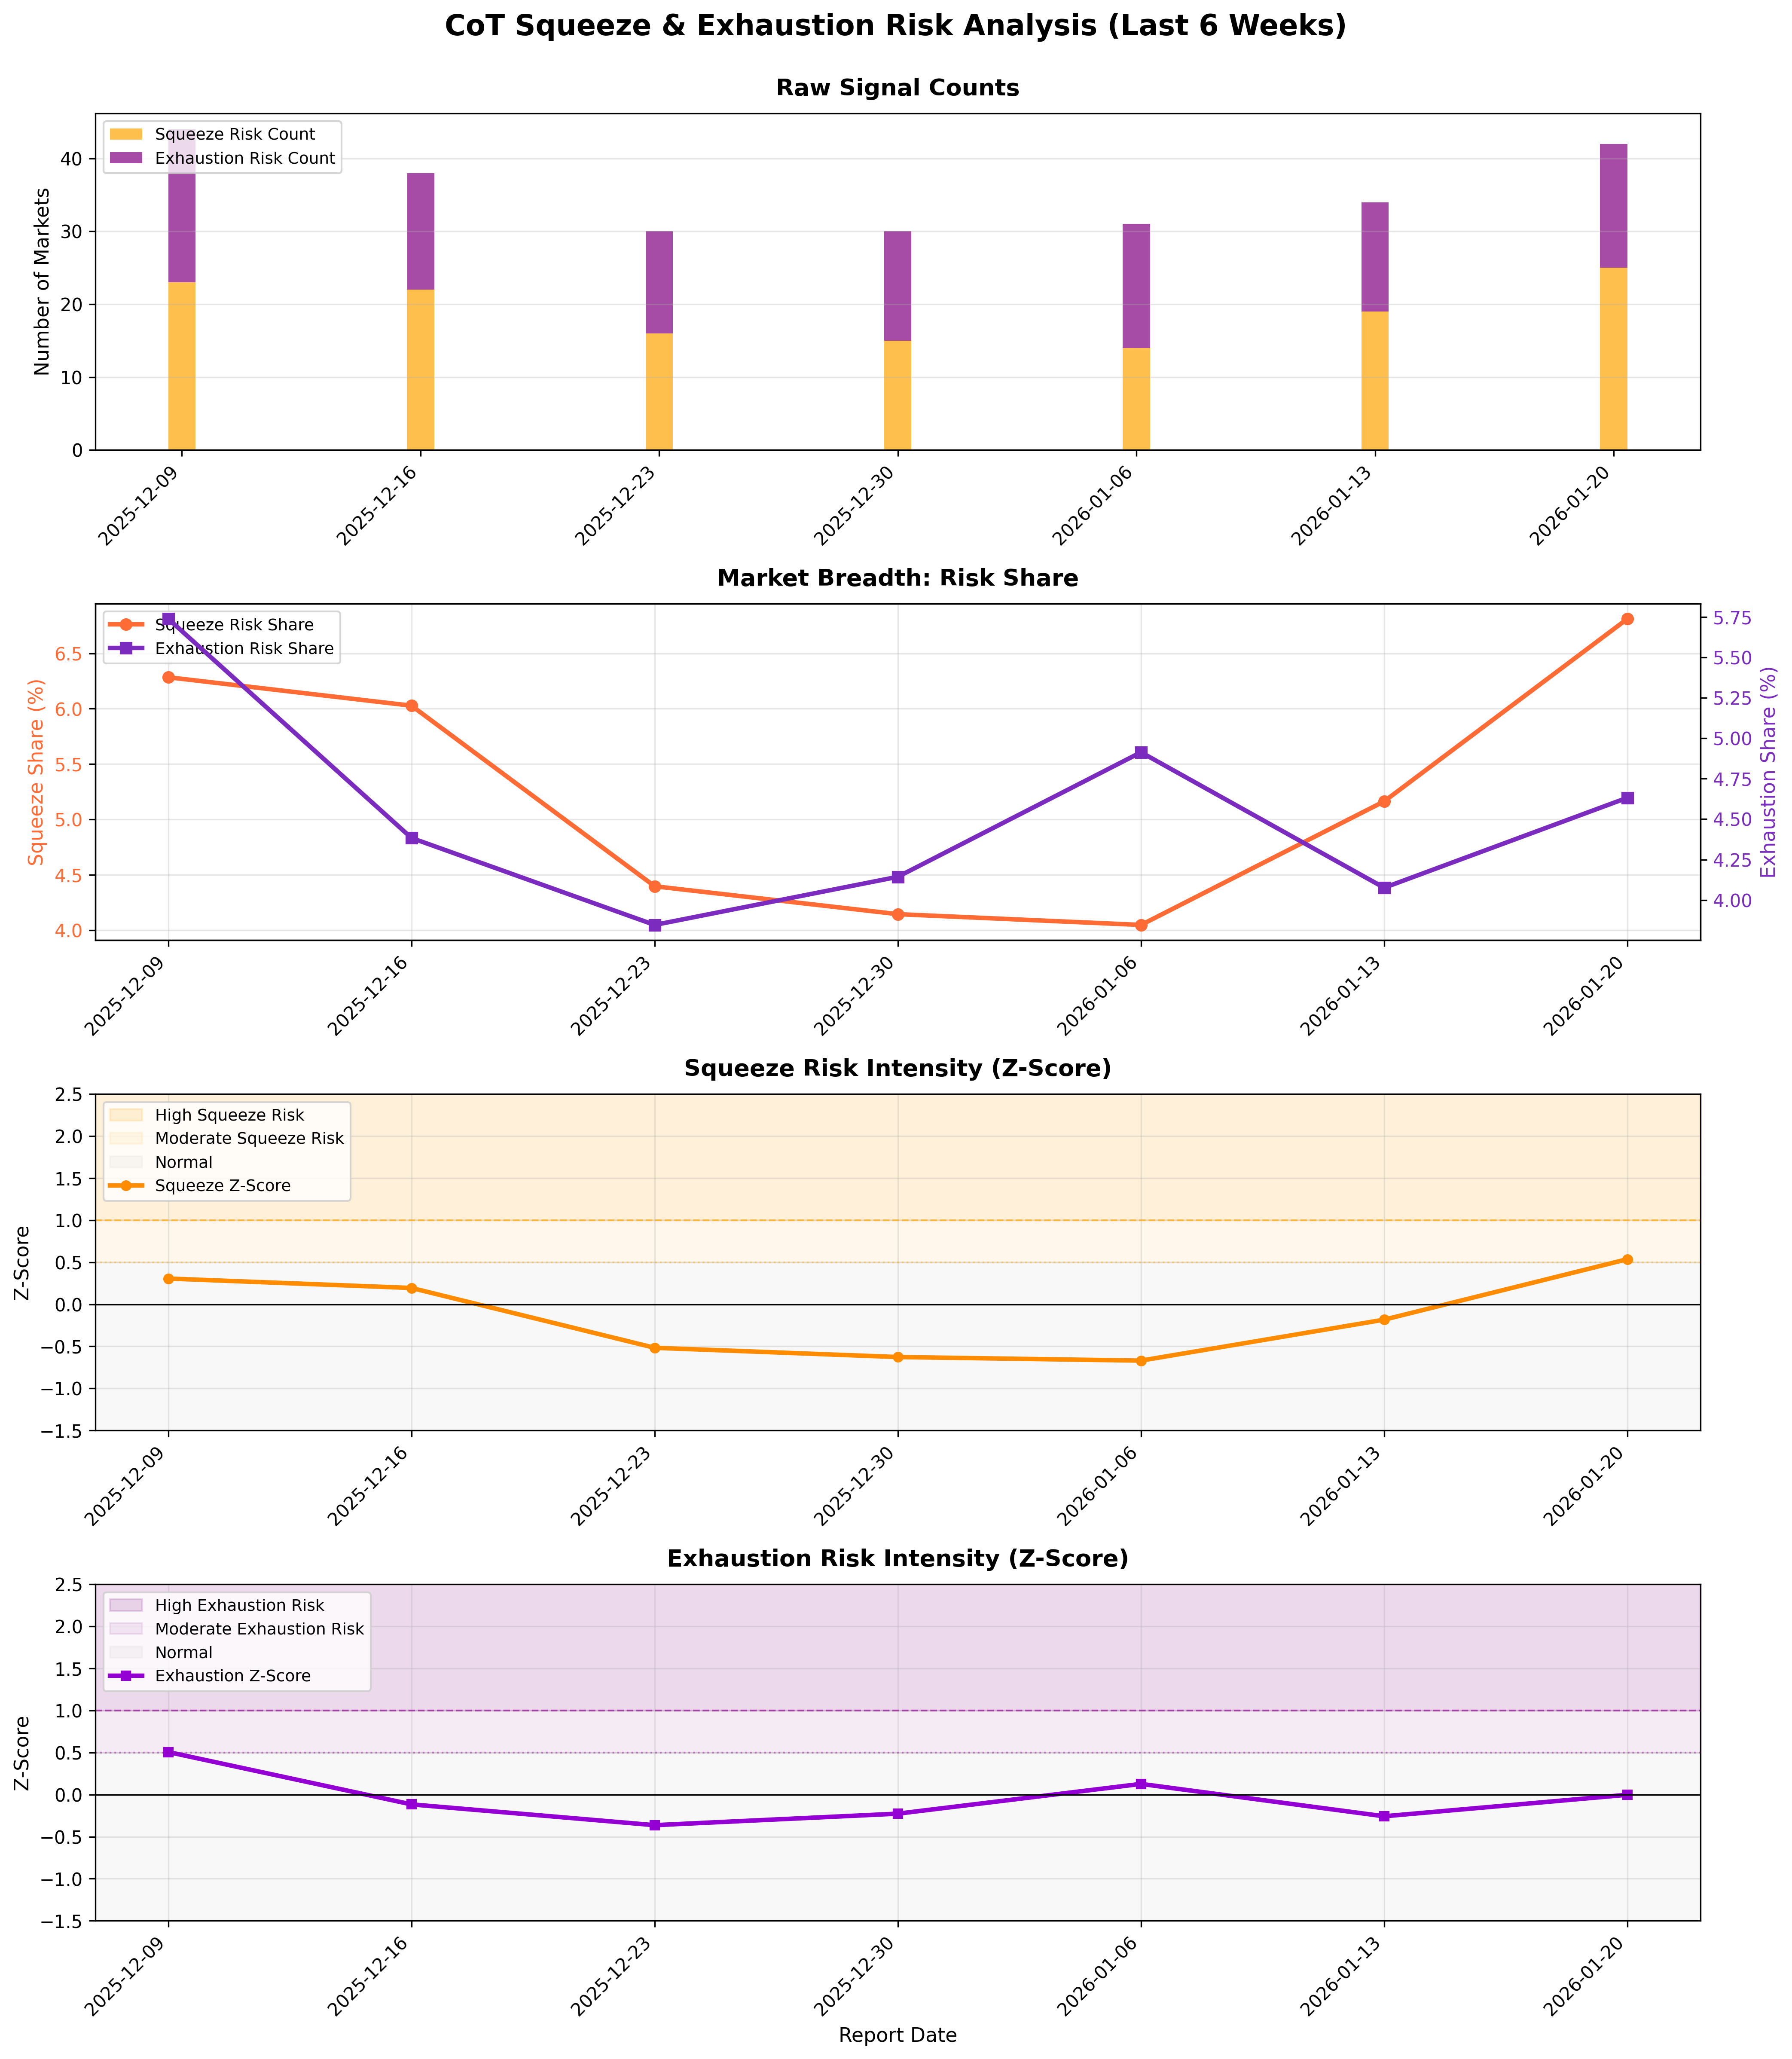
Market breadth of squeeze and exhaustion risk signals.
Squeeze & Exhaustion Risk Table▸
The information on this website is provided for general informational and educational purposes only and does not constitute financial, investment, legal, or tax advice. It does not take into account any individual objectives, financial situation, or needs.
All views expressed are personal, based on publicly available information, and do not represent the views of any employer or reflect any proprietary or internal analysis. This information should not be relied upon for making investment decisions.
No representation or warranty is made as to the accuracy, completeness, or timeliness of the information, and no liability is accepted for any loss arising directly or indirectly from its use.
All views expressed are personal, based on publicly available information, and do not represent the views of any employer or reflect any proprietary or internal analysis. This information should not be relied upon for making investment decisions.
No representation or warranty is made as to the accuracy, completeness, or timeliness of the information, and no liability is accepted for any loss arising directly or indirectly from its use.