Specs vs Hedgers Divergence: Reversal Risk
Specs vs hedgers divergence: macro reversal risk indicator.
Gemini Summary
Signal Summary:
- Configuration statement: Given a Macro Divergence Risk Z-score of -0.85 and a divergence share of 26.16%, this setup aligns with Indeterminate price paths and Compressed volatility, where the dominant risk is Trend continuation, not Regime shift, as Z-scores below -0.5 denote unusual participant alignment (1).
- The signal is currently in a "Low Divergence" regime, reflecting high positioning consensus across 367 monitored markets (1).
- Conviction Band: High; Interpretation Confidence: High Confidence; Internal Conflict Flag: No. Signal Stability Assessment: Stable; Threshold Proximity: Moderate; Revision Sensitivity: Unknown.
Methodology Applied:
- Robust Z-score < -0.5 (Low Divergence) implies trend persistence is likely and positioning-driven reversal risk is low (1).
- The signal measures the breadth of markets where Speculator and Hedger z-scores hold opposing signs exceeding |1| (1).
- Low values (consensus) denote market stability, while high values (>1.5) indicate speculative detachment from fundamentals (1).
- Dataset: Specs vs Hedgers Divergence; Latest Observation: 2026-06-09 (1).
Key Dynamics:
- The primary driver is the Macro Divergence Risk Z-score (-0.85), which remains firmly below the -0.5 threshold for consensus (1).
- Stabilisation is evident as the z-score has remained in the "Low Divergence" zone for 15 consecutive weeks (1).
- Internal offsets: Speculator and Hedger average z-scores are both near neutral (-0.03 and 0.11 respectively), suggesting no aggressive directional imbalance (1).
- Conditional Invalidation: A rise in the Robust Z-score above -0.5, indicating a breakdown in participant alignment (1).
Scenario Balance:
- Dominant base case: Trend continuation supported by unusual alignment between speculators and commercial hedgers (1).
- Upside risk: Low volatility persistence leads to further speculative positioning expansion.
- Downside risk: Sudden macro shock forces a regime shift despite current consensus.
Time Horizon & Aggregation:
- Time Horizon: Cyclical (months); the signal reflects structural positioning imbalances that typically lead macro transitions (1).
- Aggregation Weight Hint: High; the signal provides a high-confidence confirmation of market stability.
Macro Relevance:
- Informs the "Market Tone" and "Positioning" dimensions by identifying consensus versus disagreement (1).
- Economic mechanism: High participant alignment implies a shared fundamental outlook, reducing the risk of forced liquidation squeezes (1).
- Cycle position: Not determined.
Regime Context:
- Persistent regime; the "Low Divergence" state has been maintained since at least March 2026 (1).
- Direction of change: Stabilising; the z-score has narrowed its range around the -0.85 level.
Model Limitations:
- Lagging due to the reporting frequency of underlying Commitment of Traders (CoT) data (1).
- May produce noisy signals in thinly traded or illiquid markets (1).
Data & References:
Specs vs Hedgers Divergence Chart
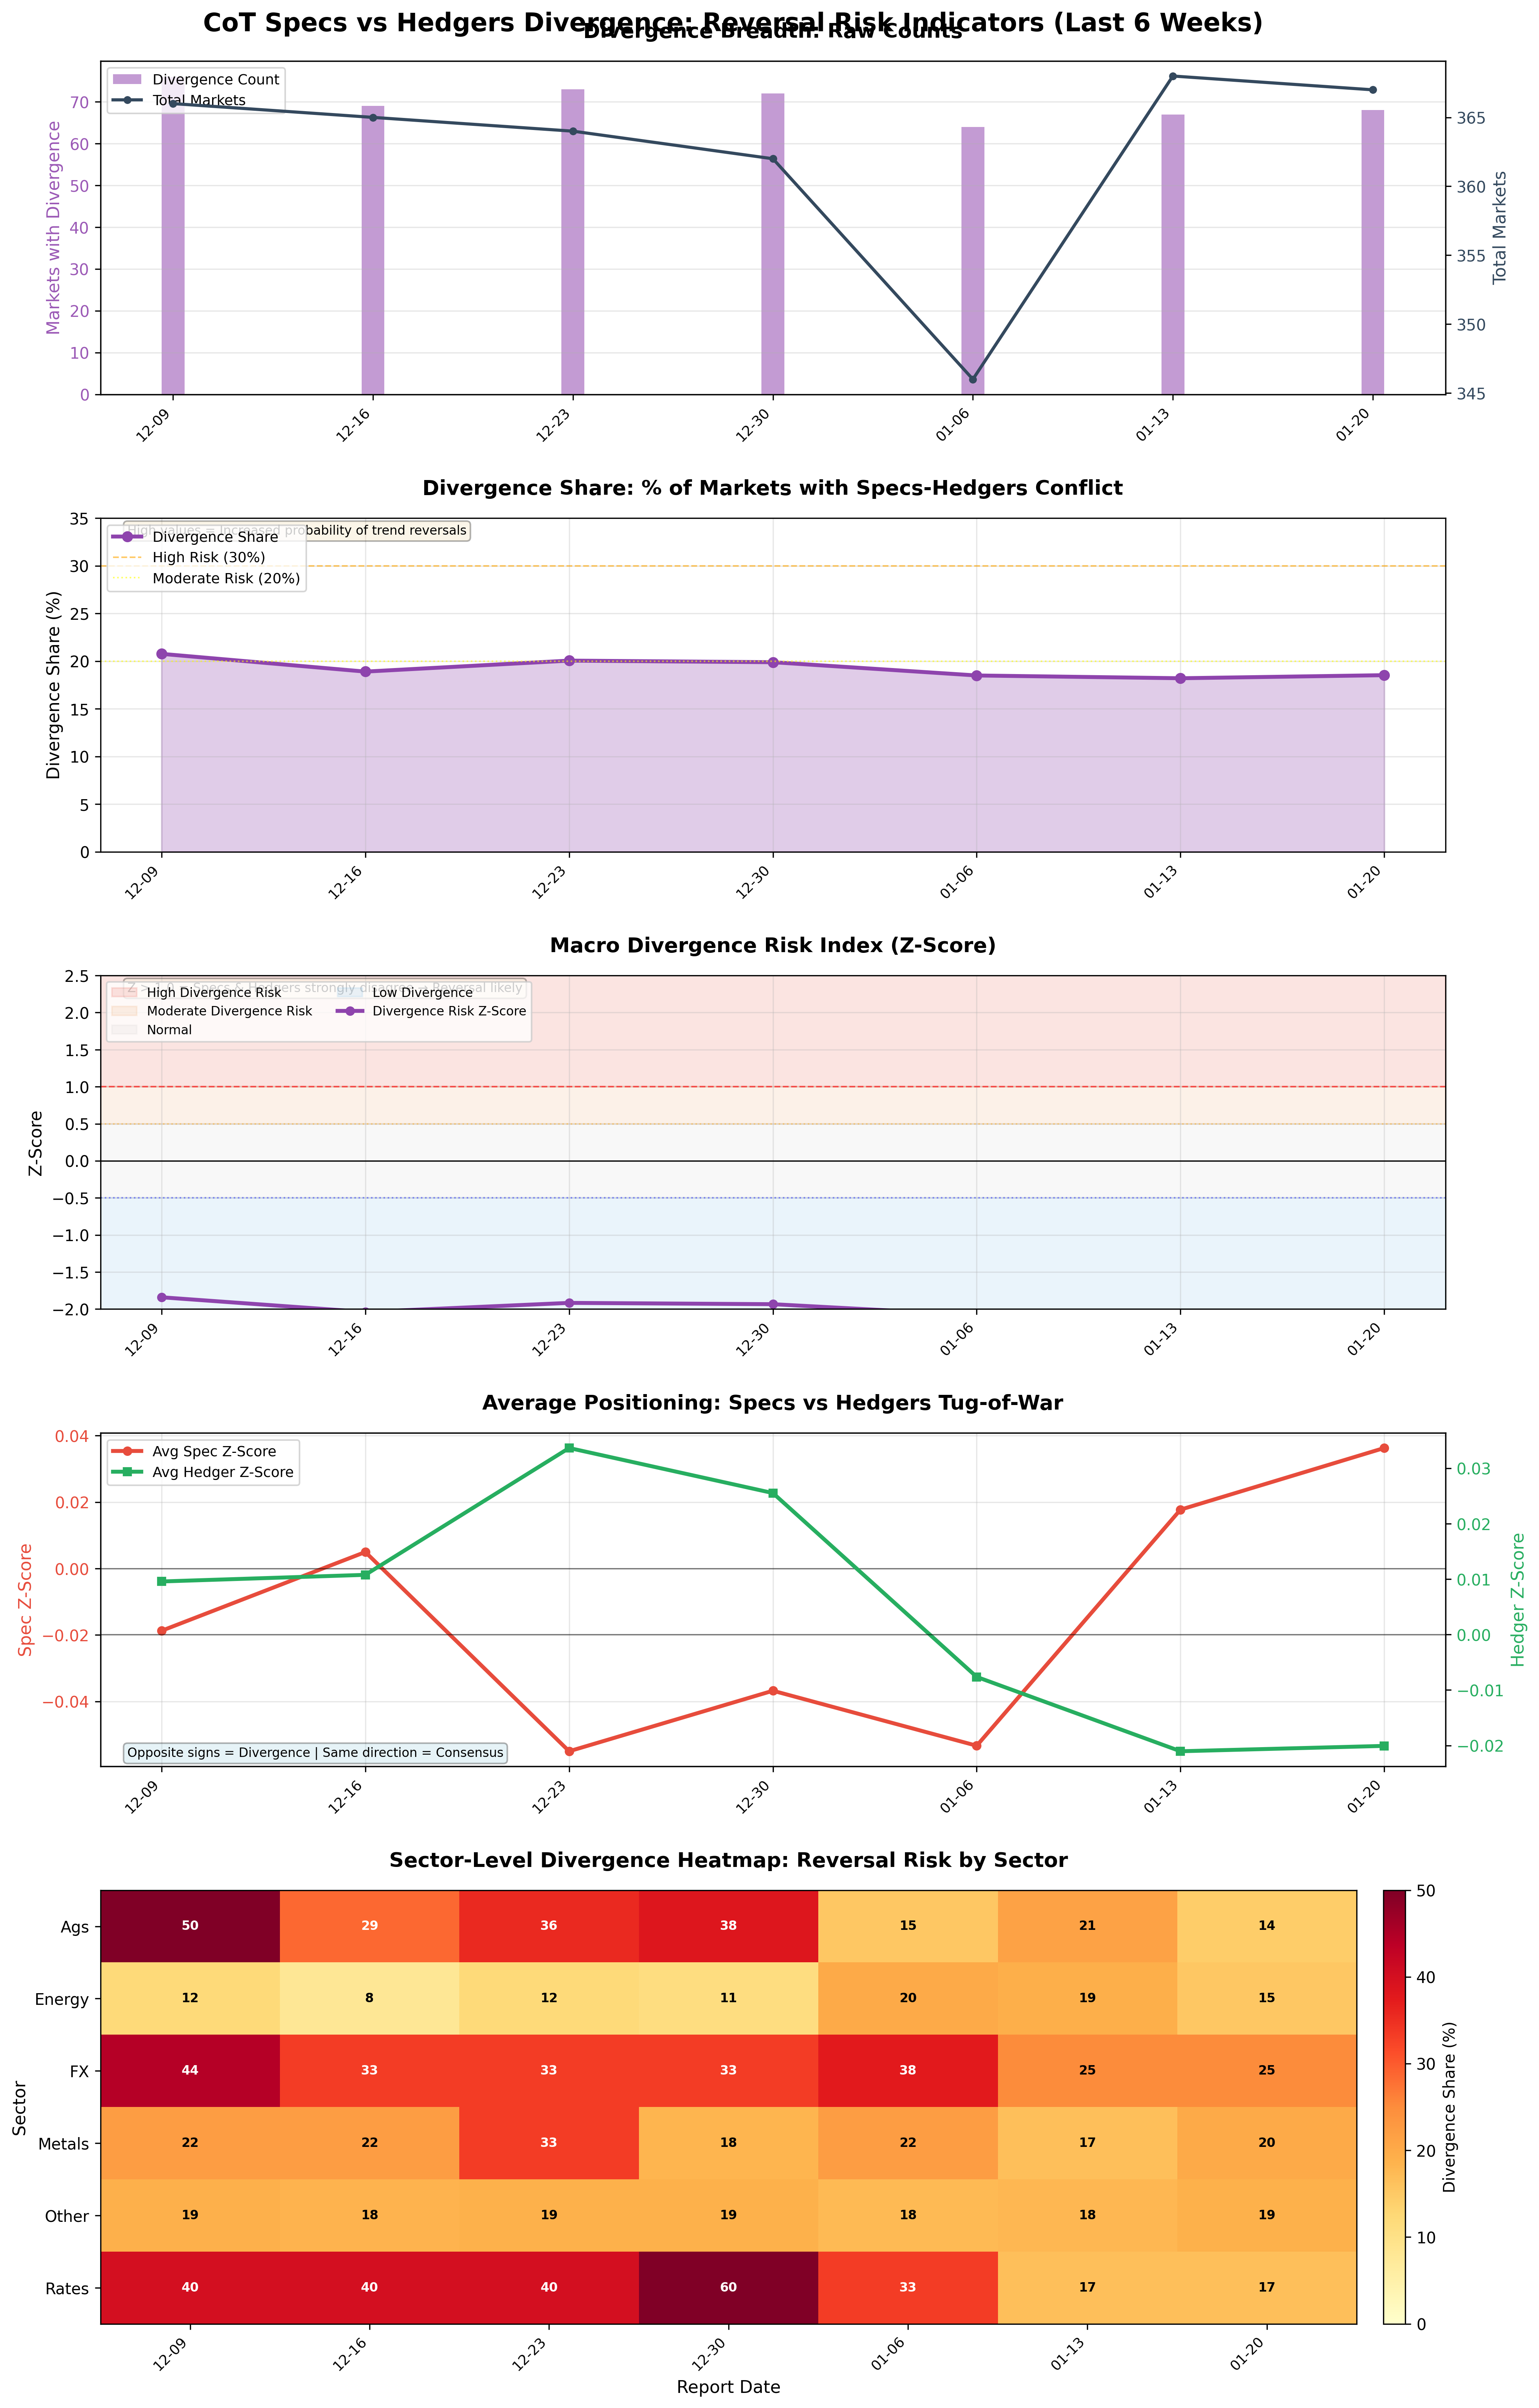
Specs vs hedgers divergence and reversal risk by market breadth.
Specs vs Hedgers Divergence Table▸
The information on this website is provided for general informational and educational purposes only and does not constitute financial, investment, legal, or tax advice. It does not take into account any individual objectives, financial situation, or needs.
All views expressed are personal, based on publicly available information, and do not represent the views of any employer or reflect any proprietary or internal analysis. This information should not be relied upon for making investment decisions.
No representation or warranty is made as to the accuracy, completeness, or timeliness of the information, and no liability is accepted for any loss arising directly or indirectly from its use.
All views expressed are personal, based on publicly available information, and do not represent the views of any employer or reflect any proprietary or internal analysis. This information should not be relied upon for making investment decisions.
No representation or warranty is made as to the accuracy, completeness, or timeliness of the information, and no liability is accepted for any loss arising directly or indirectly from its use.