Regime-Specific Macro Themes
CoT regime-specific macro themes: inflation, slowdown, supply stress, disinflation.
Gemini Summary
Signal Summary:
- Configuration statement: Given a Metals speculative long share of 0.44 and an Energy hedger deep long share of 0.37, this setup aligns with Transition-biased price paths and Normal volatility, where the dominant risk is Regime shift, not trend continuation (1).
- The signal currently identifies an active Supply Stress regime in Energy and Ags, while Metals show signs of a fading Inflation Impulse.
- Conviction Band: Medium; Interpretation Confidence: Mixed Signals; Internal Conflict Flag: Yes. Signal Stability Assessment: Volatile; Threshold Proximity: Near; Revision Sensitivity: Unknown.
Methodology Applied:
- Supply Stress is activated when commercial hedgers are deep long in Energy or Agricultural sectors (1).
- Inflation Impulse requires concurrent high speculative longs and producer hedging (shorts) in both Energy and Metals (1).
- The avg_spec_zscore measures speculative crowding breadth, used to distinguish between impulse and disinflation regimes (1).
- Sector Theme dataset used; latest observation date: 2026-06-09 (1). Data timeliness cannot be assessed.
Key Dynamics:
- The primary driver is the high share of deep long commercial hedgers in Energy (0.37), triggering the Supply Stress rule (1).
- Metals speculative momentum is decelerating, with the avg_spec_zscore falling from 0.83 to 0.51 over the last three periods (1).
- Internal Tension: Significant divergence in Energy, where 44% of speculators are crowded short despite heavy commercial long positioning.
- Conditional Invalidation: A decline in Energy hedger deep long shares below sector averages (1).
Scenario Balance:
- Base case dominant: Supply Stress persists as commercial hedging offsets speculative short-selling in Energy.
- Upside risk: Re-acceleration of Metals spec z-scores triggering a broader Inflation Impulse.
- Downside risk: Transition to Global Slowdown if Metals speculative shorts begin to dominate.
Time Horizon & Aggregation:
- Time Horizon: Cyclical (months) as positioning regimes typically reflect multi-month economic narratives (1).
- Aggregation Weight Hint: Medium due to the presence of conflicting speculator/hedger signals in Energy.
Macro Relevance:
- Informs the pricing and supply stress dimensions of global macro (1).
- Implied economic mechanism: Physical market tightness or geopolitical stress driving hedger demand despite speculative bearishness.
- Cycle position: Not determined.
- Typically interacts with USD trends and realized volatility to confirm risk-off or inflationary regimes (1).
Regime Context:
- Transitioning from a pure Metals-led Inflationary setup toward a fragmented Energy Supply Stress regime.
- Direction of change: Weakening speculative conviction in growth-sensitive sectors (Metals, FX).
Model Limitations:
- Binary regime flags do not encode the intensity of the macro state (1).
- Sector mapping relies on heuristics that may lag sudden market shifts (1).
Data & References:
- Theme Continuous / Sector Theme (2026-06-09) (1).
- Most influential: Energy hedger_deep_long_share (0.37) and Rates avg_hedger_zscore (0.85).
- Credit spread indices and USD spot indices would improve regime validation.
Macro Themes Chart
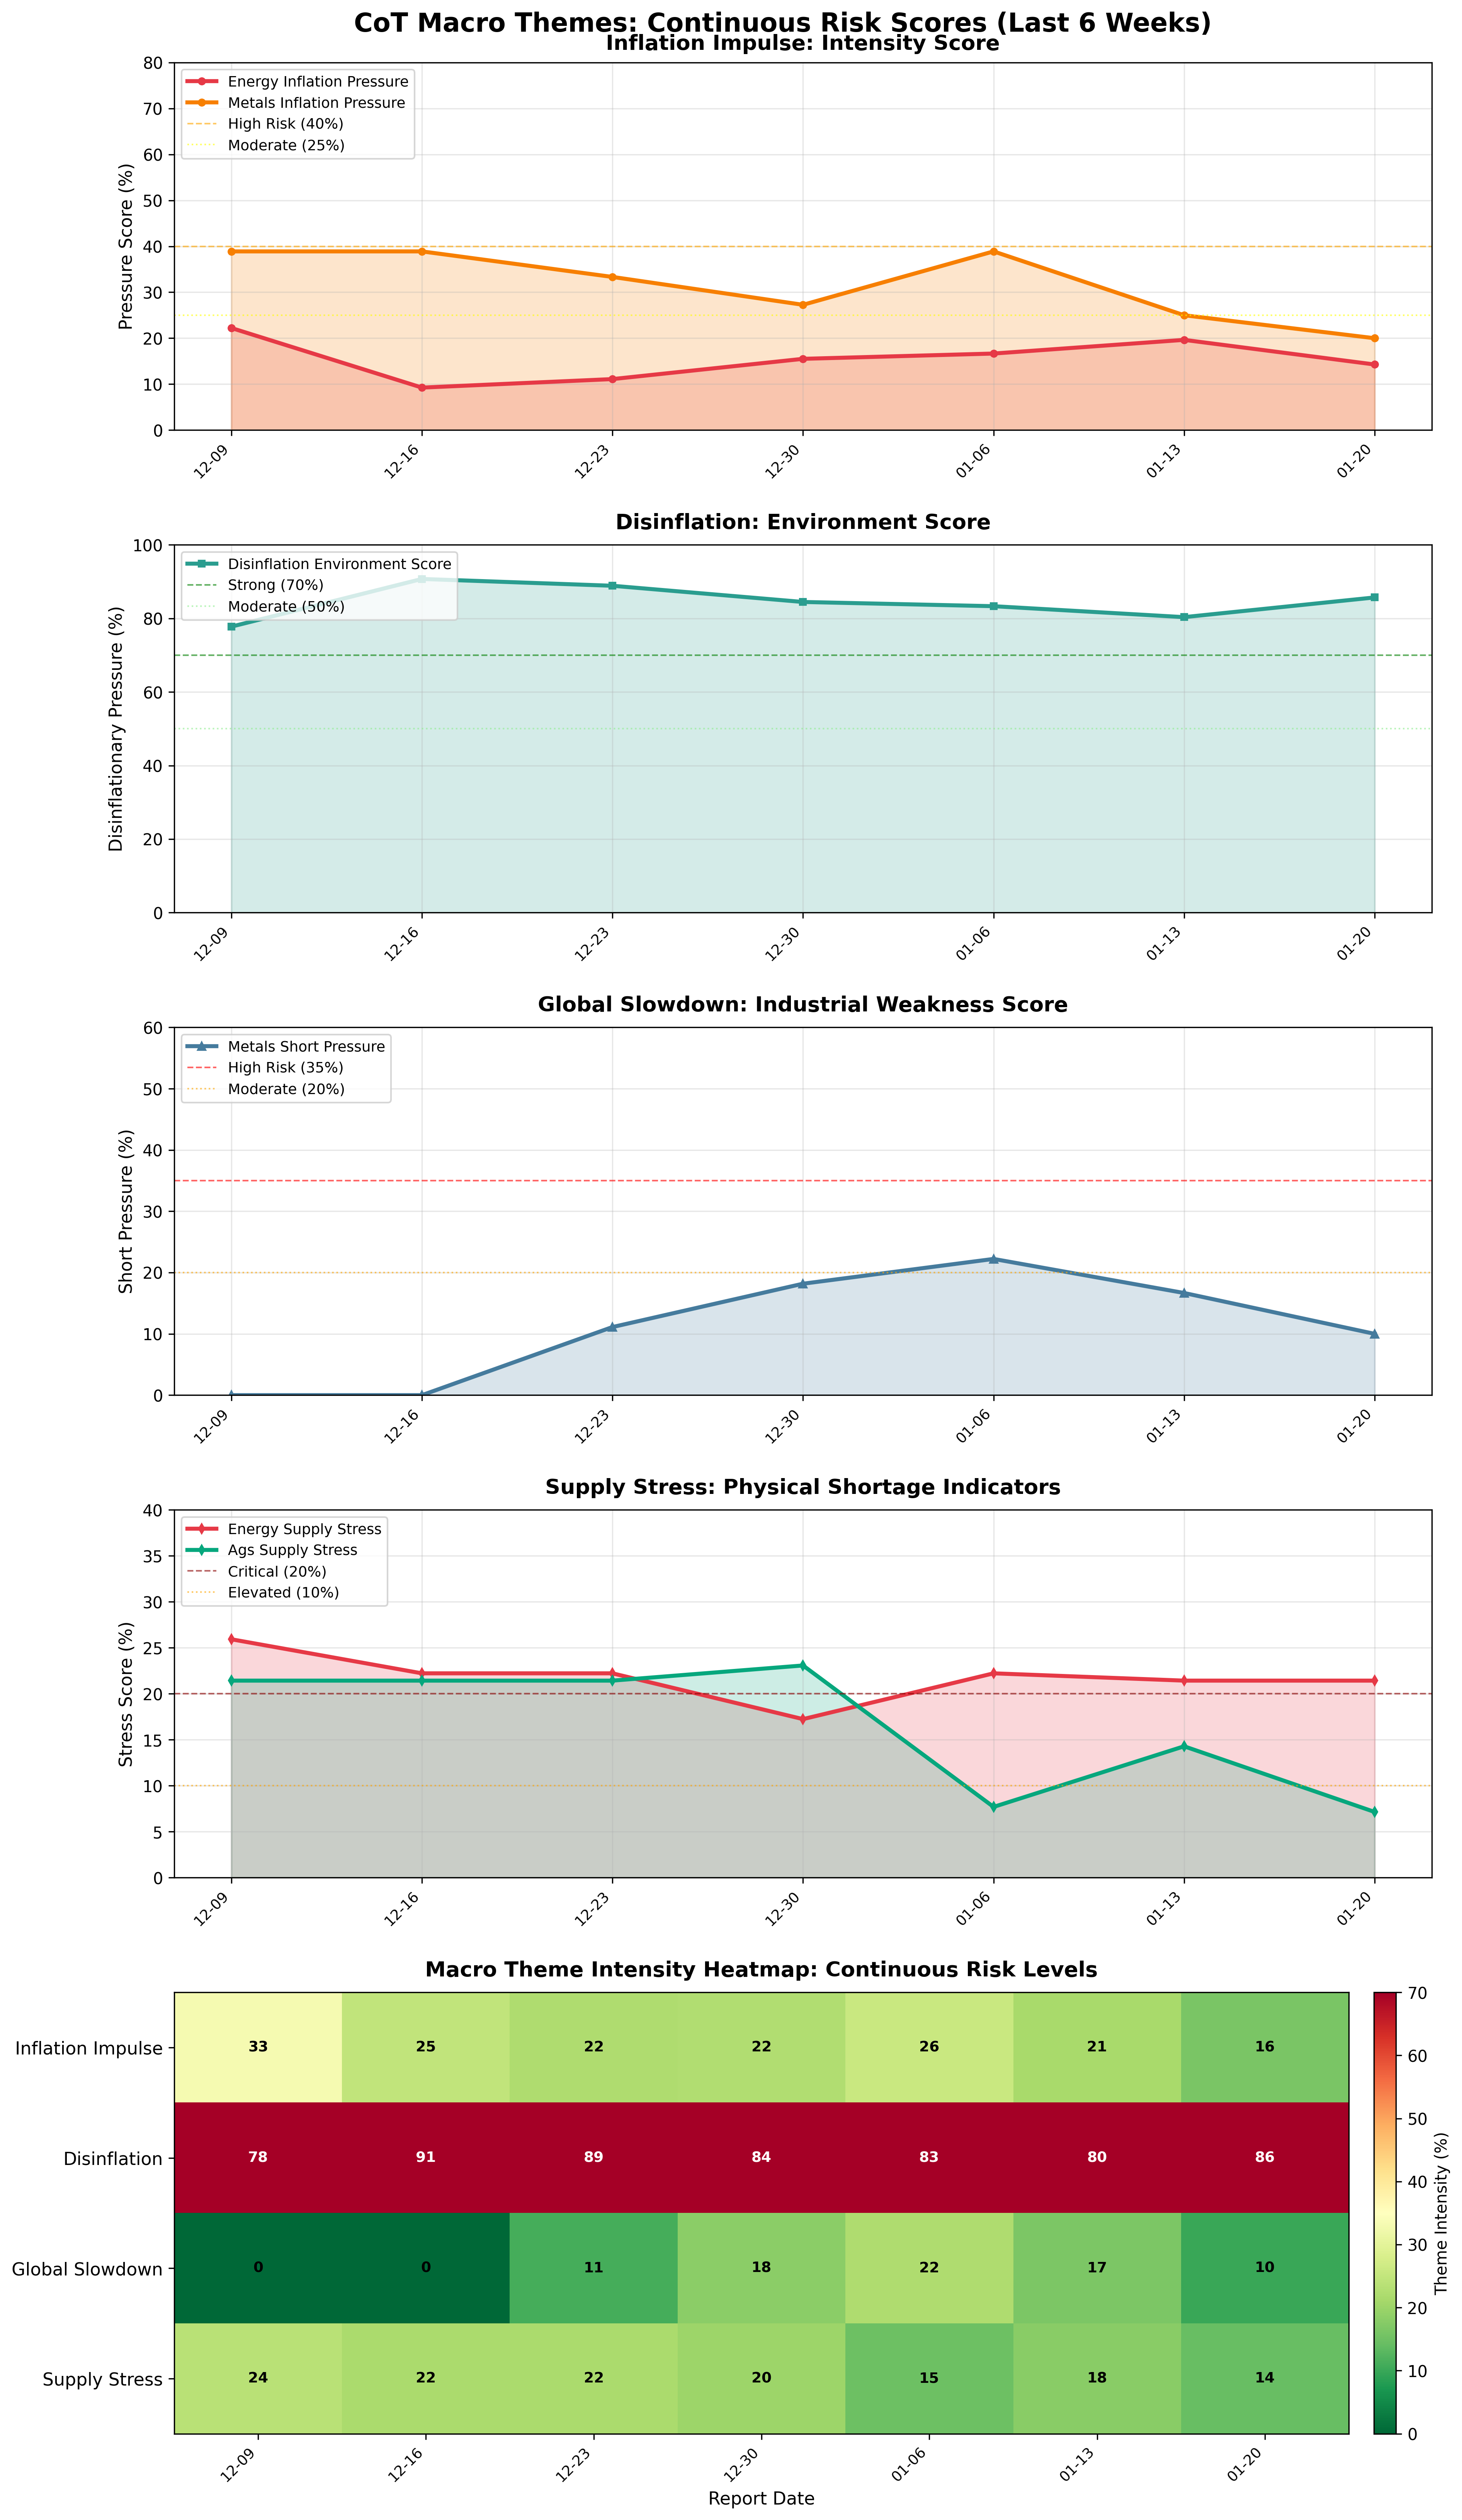
Continuous macro theme intensity scores and heatmap.
Macro Themes Table▸
The information on this website is provided for general informational and educational purposes only and does not constitute financial, investment, legal, or tax advice. It does not take into account any individual objectives, financial situation, or needs.
All views expressed are personal, based on publicly available information, and do not represent the views of any employer or reflect any proprietary or internal analysis. This information should not be relied upon for making investment decisions.
No representation or warranty is made as to the accuracy, completeness, or timeliness of the information, and no liability is accepted for any loss arising directly or indirectly from its use.
All views expressed are personal, based on publicly available information, and do not represent the views of any employer or reflect any proprietary or internal analysis. This information should not be relied upon for making investment decisions.
No representation or warranty is made as to the accuracy, completeness, or timeliness of the information, and no liability is accepted for any loss arising directly or indirectly from its use.