Real Interest Rate Trend Signal
Real yields and trend momentum as a macro-financial tightening indicator.
Gemini Summary
Signal Summary:
- Configuration statement: Given a 10-year TIPS Real Yield of 1.90% and a 6-month trend of 1.935%, this setup aligns with Range-biased price paths and Compressed volatility, where the dominant risk is Mean reversion, not Trend continuation (1).
- The signal is currently classified as Neutral, reflecting real rates that are stable and following the established trend (1).
- Conviction Band: Medium; Interpretation Confidence: High Confidence; Internal Conflict Flag: No. Signal Stability Assessment: Stable; Threshold Proximity: Near; Revision Sensitivity: Unknown.
Methodology Applied:
- Real yield values within +/- 0.05% of the 6-month moving average are defined as Neutral, indicating no clear directional impulse (1).
- Values more than 0.05% above trend signify restrictive financial conditions (Bearish), while values more than 0.05% below signify easing (Bullish) (1).
- Real Interest Rate Trend Signal (1): latest observation 2025-09-01.
Key Dynamics:
- The primary driver is the 10-year TIPS yield (1.90%), which has converged toward its 1.935% moving average (1).
- The signal has stabilised in Neutral territory for three consecutive months following a Bearish (restrictive) regime in early 2025 (1).
- Conditional Invalidation: A move in the Real Yield above 1.985% or below 1.885% would trigger a regime shift (1).
- The current state shows high persistence, with volatility in real rates compressing significantly since May 2025 (1).
Scenario Balance:
- Dominant base case: Continued Neutrality as real yields track the 6-month trend without significant policy or growth shocks.
- Upside risk: Transition to Bullish regime if real yields fall 0.05% below trend, likely triggered by easing inflation expectations.
- Downside risk: Re-entry into Bearish territory if real yields rise 0.05% above trend, triggered by restrictive Fed policy repricing.
Time Horizon & Aggregation:
- Time Horizon: Cyclical (months) based on the 6-month moving average smoothing window (1).
- Aggregation Weight Hint: Medium, as real rates are a foundational driver of financial conditions and asset valuations (1).
Macro Relevance:
- Informs the "monetary conditions" macro dimension by measuring the marginal impulse of inflation-adjusted borrowing costs (1).
- Economic mechanism: Neutral real rates suggest a stabilization of the cost of capital, potentially alleviating margin pressure for risk assets (1).
- Cycle position: Not determined by this methodology.
- Typically interacts with nominal yields and breakeven inflation to confirm the source of real rate moves (1).
Regime Context:
- This is a persistent Neutral regime that has lasted for 3 months (1).
- Direction of change: Stabilising, following a transition from a Bearish (restrictive) configuration in June 2025 (1).
Model Limitations:
- Lagging behavior inherent in the 6-month moving average window (1).
- Does not distinguish between absolute yield levels, only direction relative to trend (1).
Data & References:
Real Interest Rate Trend Chart
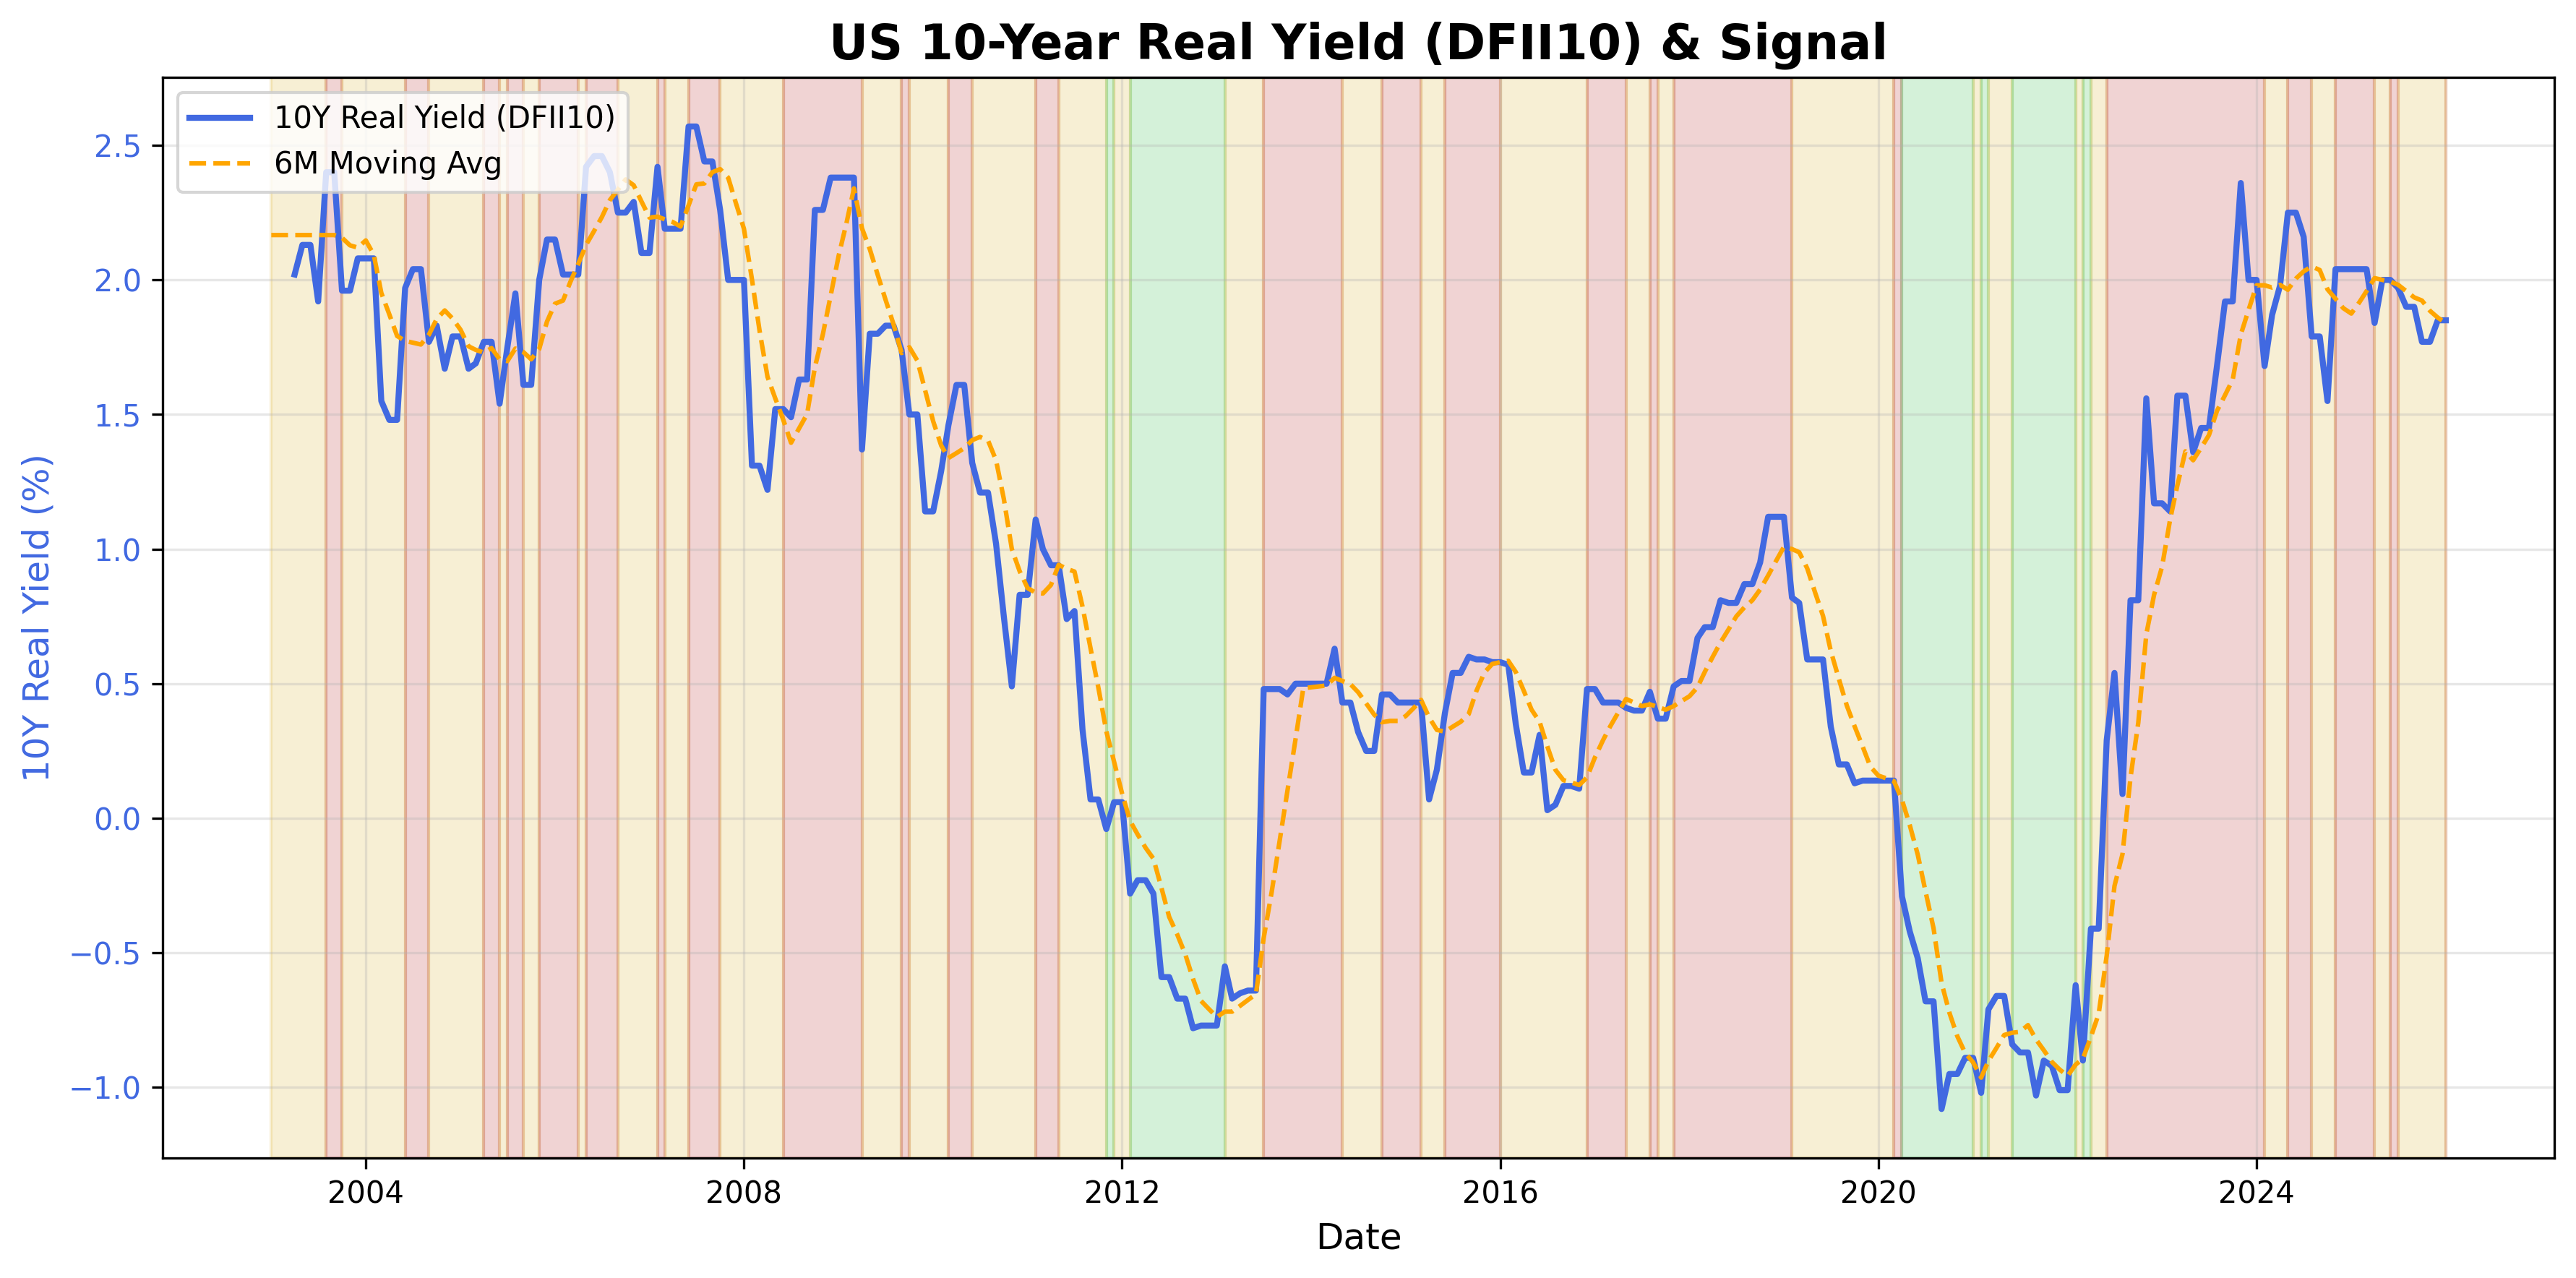
U.S. real yield levels and trend dynamics.
Real Interest Rate Table▸
The information on this website is provided for general informational and educational purposes only and does not constitute financial, investment, legal, or tax advice. It does not take into account any individual objectives, financial situation, or needs.
All views expressed are personal, based on publicly available information, and do not represent the views of any employer or reflect any proprietary or internal analysis. This information should not be relied upon for making investment decisions.
No representation or warranty is made as to the accuracy, completeness, or timeliness of the information, and no liability is accepted for any loss arising directly or indirectly from its use.
All views expressed are personal, based on publicly available information, and do not represent the views of any employer or reflect any proprietary or internal analysis. This information should not be relied upon for making investment decisions.
No representation or warranty is made as to the accuracy, completeness, or timeliness of the information, and no liability is accepted for any loss arising directly or indirectly from its use.