Real Interest Rate Trend Signal
Real yields and trend momentum as a macro-financial tightening indicator.
Gemini Summary
Signal Summary:
- The US 10-year real yield signal is currently classified as Bearish as of 2026-01-01 (1).
- This indicates a state of tightening or restrictive monetary conditions (1).
- Conviction Band: Low, Interpretation Confidence: Mixed Signals, Internal Conflict Flag: Yes.
Key Dynamics:
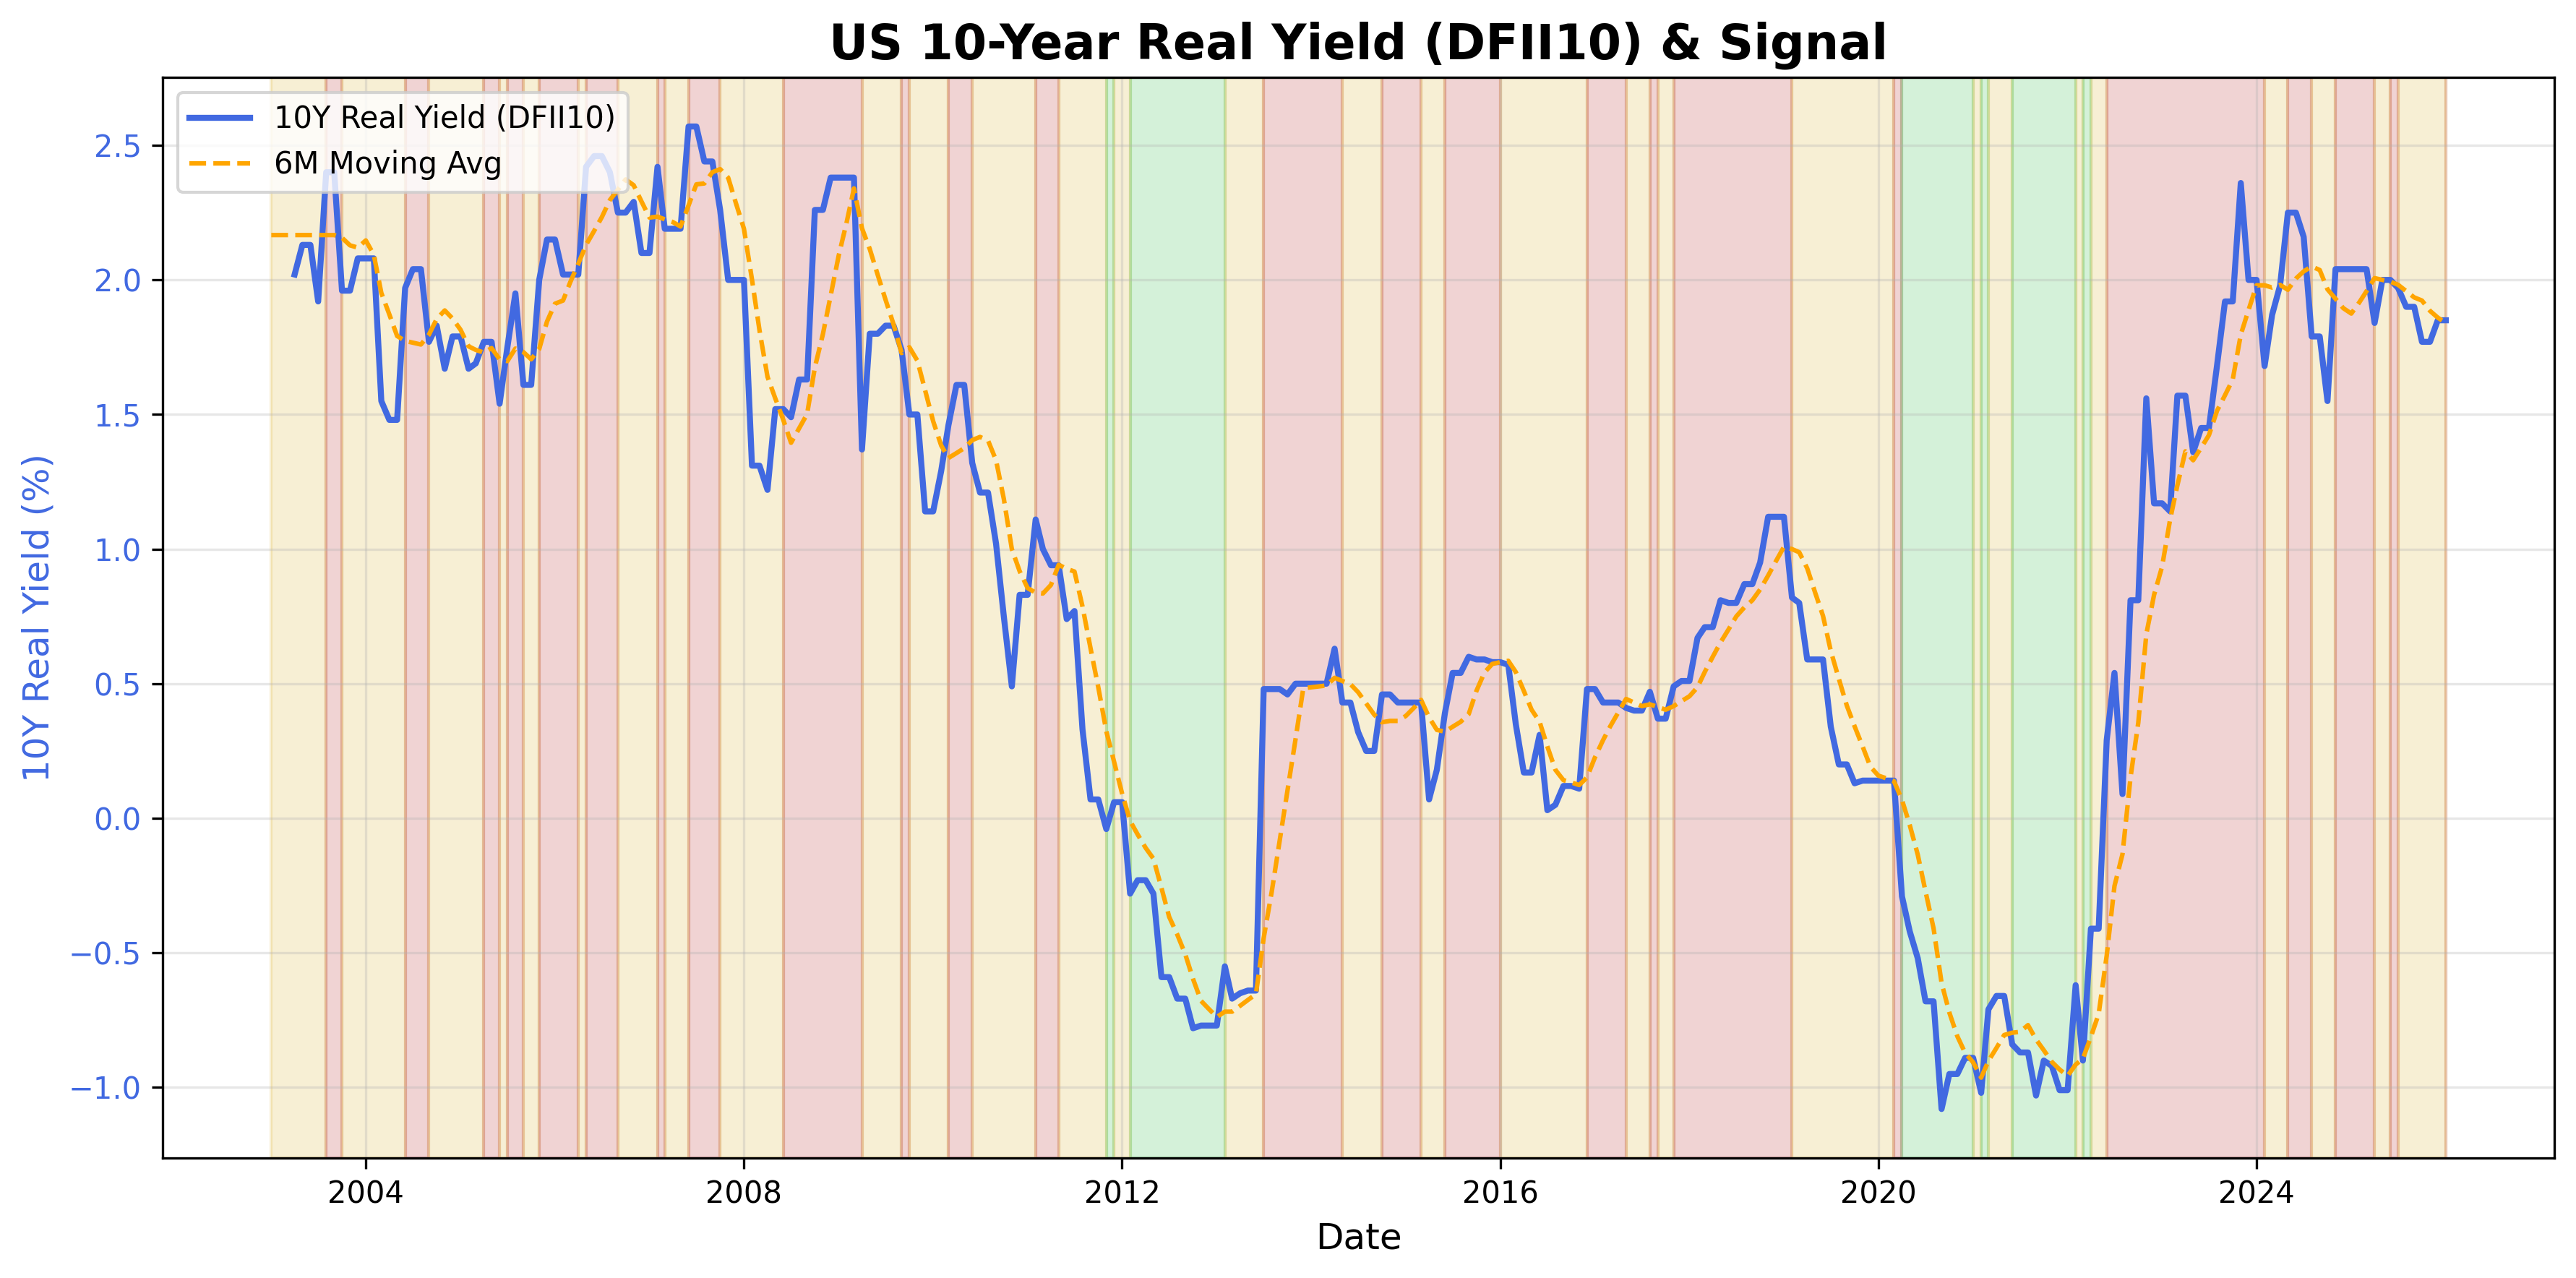
- The latest real yield value (1.85%) is slightly above its 6-month moving average trend (1.84%) as of 2026-01-01 (1).
- The signal's classification into 'Bearish' suggests a restrictive stance, though the magnitude of the difference from its trend is small (1).
- There is an internal tension as the explicit methodology would classify the current state as Neutral given the small deviation (0.01%) from the trend, yet the provided signal column states Bearish (1).
- Conditional Invalidation: The signal would reverse to Bullish or Neutral if the real yield falls below its 6-month trend by more than 0.05% or moves within the ±0.05% neutral band (1).
Scenario Balance:
- Base Case dominant: Real yields remain marginally above trend, sustaining a Bearish signal based on the current classification mechanism.
- Most plausible upside risk and trigger: Real yields soften, falling back into the neutral band (within ±0.05% of trend) or below it, triggered by slowing economic data or easing inflation expectations.
- Most plausible downside risk and trigger: Real yields increase significantly above trend, indicating further tightening, potentially driven by persistent inflation or robust growth surprises.
Time Horizon & Aggregation:
- Time Horizon: Cyclical (months), reflecting the 6-month moving average used for trend identification (1).
- Aggregation Weight Hint: Low, due to the identified internal conflict and resulting mixed interpretation confidence.
Macro Relevance:
- This signal primarily informs the Liquidity and Monetary Conditions macro dimension (2).
- It helps gauge the true cost of capital and the stance of monetary policy, typically relevant for mid-to-late cycle analysis.
- Interacts with inflation expectations and growth signals, indicating if real returns are rising (restrictive) or falling (accommodative) for broader asset valuations.
Data & References:
- US 10-Year Treasury Inflation-Indexed Security (DFII10), latest value 1.85% as of 2026-01-01 (1).
- The 6-month moving average of DFII10 (Trend) at 1.84% is most influential for the current state (1).
- Additional public datasets that would improve depth or reliability: 5-Year TIPS real yield, and market-implied inflation expectations from breakeven rates.
Real Interest Rate Trend Chart
U.S. real yield levels and trend dynamics.