Private Credit Impulse Signal
Private credit impulse: momentum in bank and consumer credit growth.
Gemini Summary
Signal Summary:
- Configuration statement: Given a Private Credit Impulse of 1.22 and a z-score for business loans of 2.53, this setup aligns with Upward-biased price paths and Normal volatility, where the dominant risk is Trend continuation, not Mean reversion. (1)
- The signal is currently in an Accelerating regime, having crossed the expansionary threshold in March 2026 and persisting through April 2026. (1)
- Conviction Band: High; Interpretation Confidence: High Confidence; Internal Conflict Flag: No. Signal Stability Assessment: Improving; Threshold Proximity: Far; Revision Sensitivity: High.
Methodology Applied:
- Composite values exceeding 0.75 for two consecutive months indicate accelerating credit growth and an expansionary environment. (1)
- Business lending components (BUSLOANS) are prioritized for detecting cyclical sensitivity. (1)
- A 2-period confirmation rule is required to filter noise and validate regime shifts. (1)
- Data used: Federal Reserve H.8 bank credit and consumer credit aggregates; latest full observation 2026-04-30. (1)
Key Dynamics:
- The primary driver is the surge in business loan momentum, with the BUSLOANS z-score rising from 0.92 in early 2026 to 2.53 by April. (1)
- Total bank credit (TOTBKCR) shows stabilization and moderate growth, supporting the broader impulse. (1)
- Internal coherence is high as both business and bank credit metrics are trending upward simultaneously.
- Conditional Invalidation: The regime reverts to Neutral if the composite value falls below 0.75 for two consecutive months. (1)
- The signal has transitioned from a Stable regime (late 2025) to a strengthening Accelerating regime. (1)
Scenario Balance:
- Dominant base case: Sustained economic expansion driven by robust business credit demand.
- Most plausible upside risk: A credit boom where consumer credit (TOTALSL) accelerates to match business loan strength.
- Most plausible downside risk: Negative revisions to H.8 data or a sharp tightening in funding conditions. (1)
Time Horizon & Aggregation:
- Time Horizon: Cyclical (months), reflecting medium-term shifts in credit creation and economic demand. (1)
- Aggregation Weight Hint: High, as credit impulse is a leading indicator for cyclical turning points. (1)
Macro Relevance:
- Informs the Demand and Liquidity dimensions by measuring the rate of private sector credit creation. (1)
- Economic mechanism: Improving credit availability and demand typically signal an early-to-mid cycle risk-on environment. (1)
- Cycle position: Mid-cycle expansion (supported by persistent acceleration rules). (1)
- Typically interacts with inflation and GDP signals to confirm if growth is real or purely nominal. (1)
Regime Context:
- Newly entered Accelerating regime as of March 2026.
- The direction of change is strengthening, with the impulse value rising significantly above the 0.75 threshold. (1)
Model Limitations:
- High revision risk in weekly H.8 data may alter recent readings. (1)
- Securitization shifts can create artificial volatility in the credit aggregates. (1)
Data & References:
Private Credit Impulse Chart
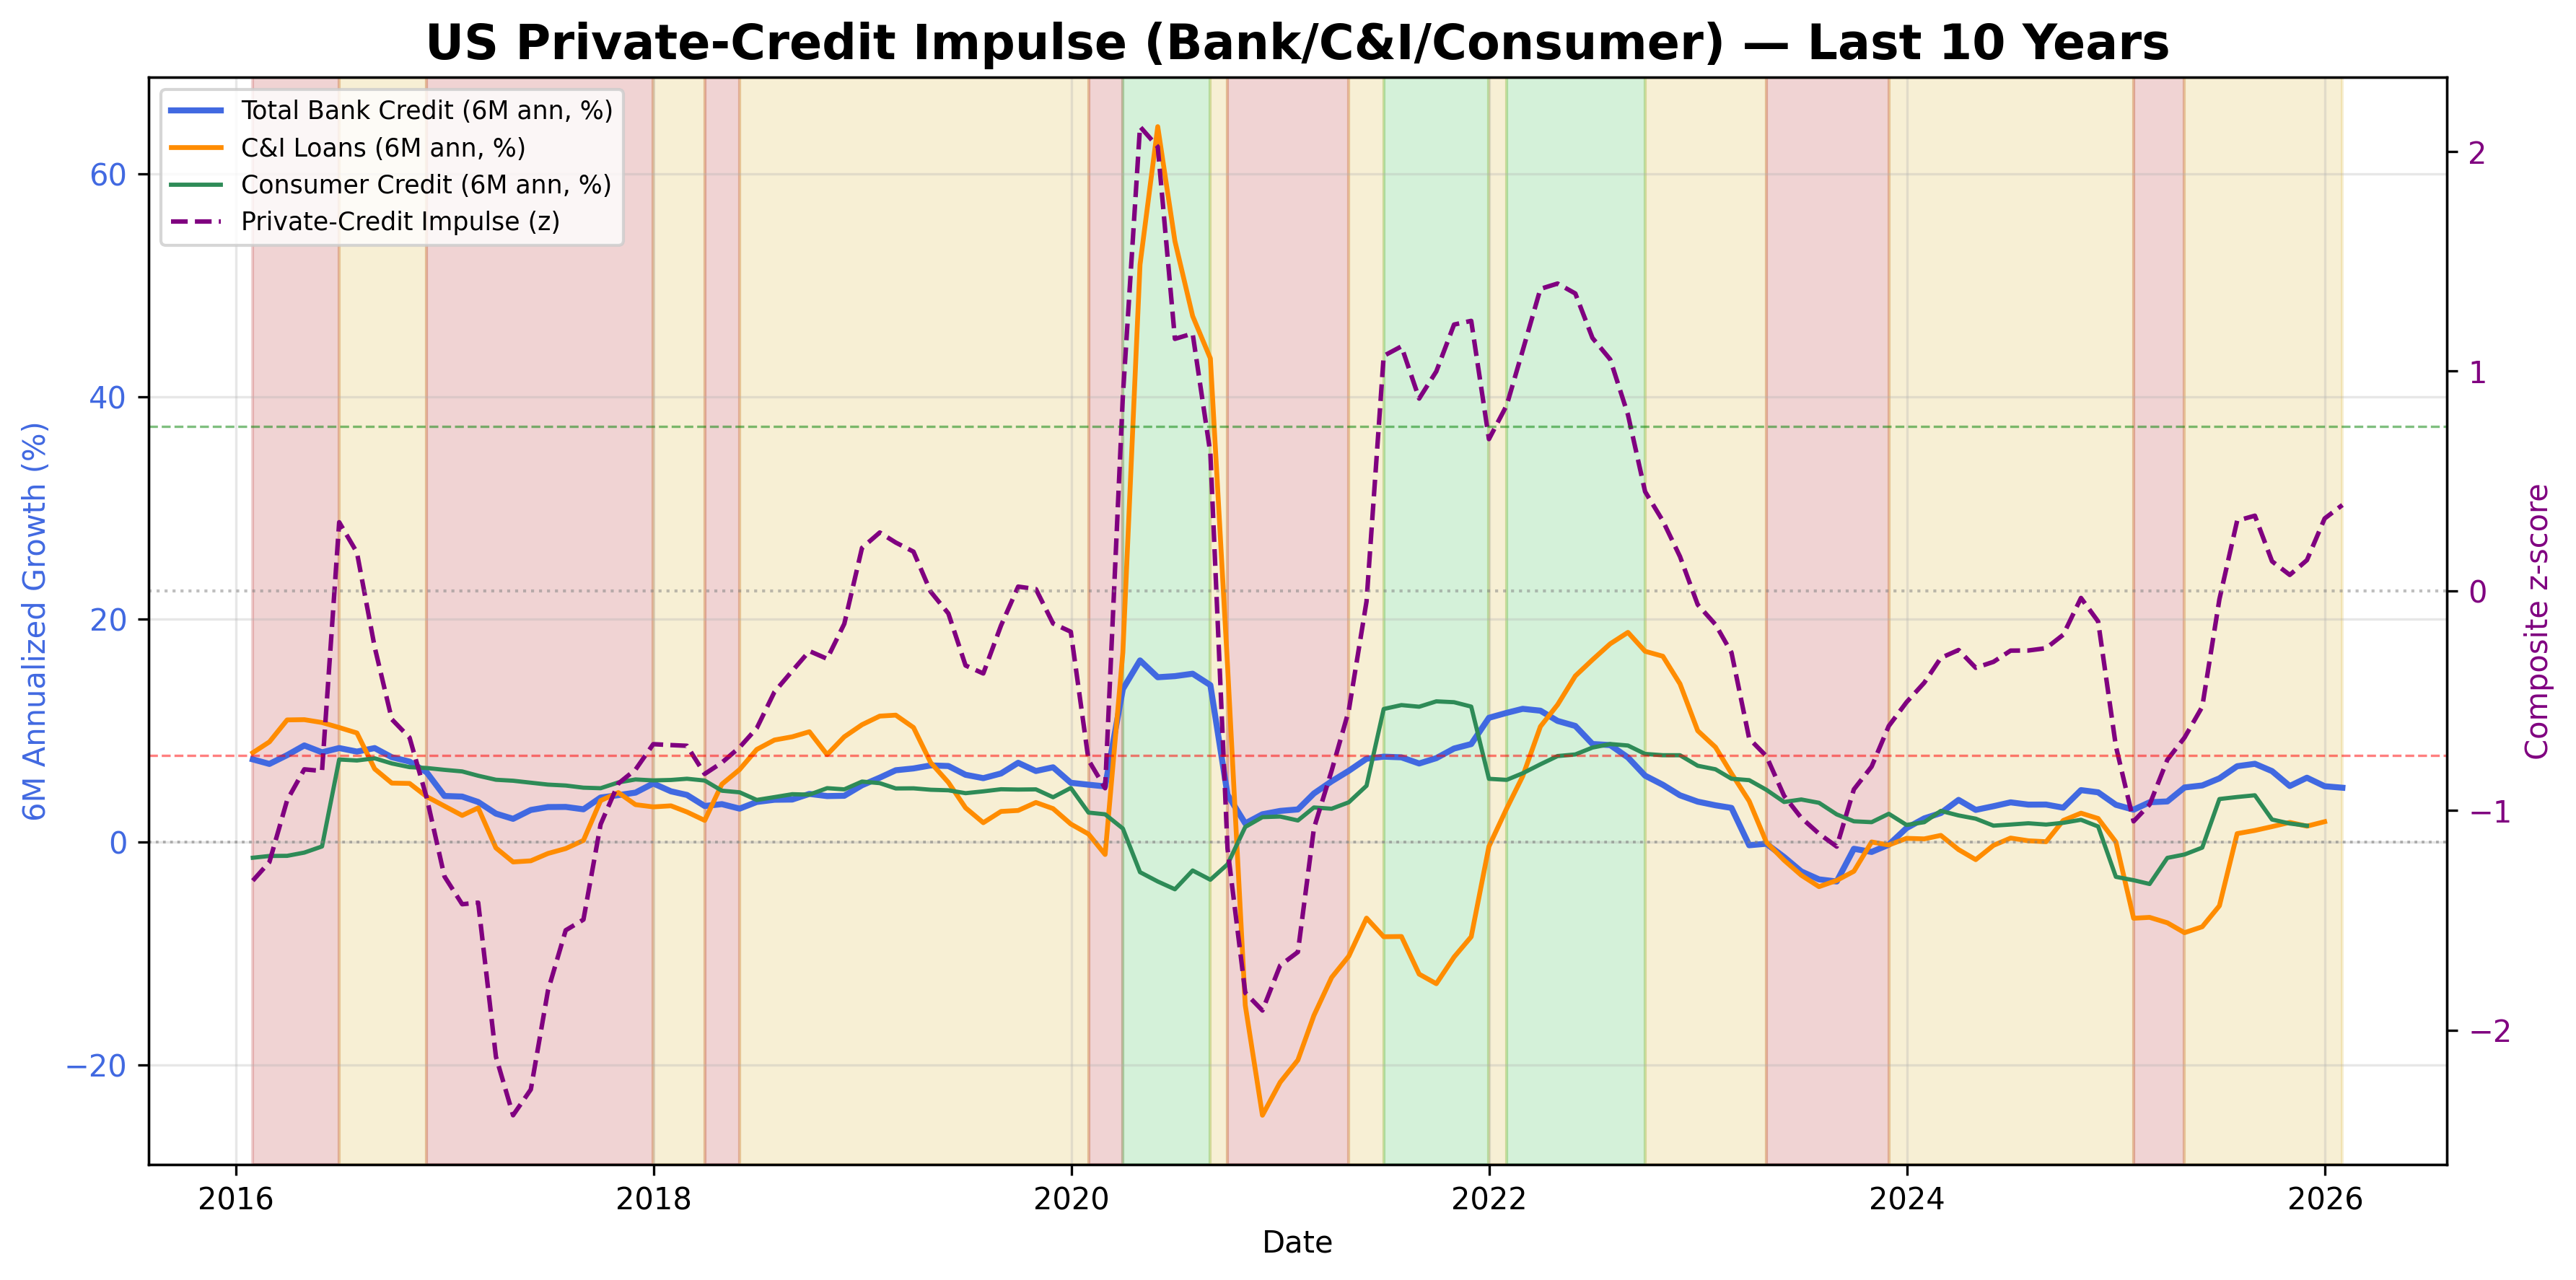
Momentum in U.S. bank credit, business lending, and consumer loans.
Private Credit Impulse Table▸
The information on this website is provided for general informational and educational purposes only and does not constitute financial, investment, legal, or tax advice. It does not take into account any individual objectives, financial situation, or needs.
All views expressed are personal, based on publicly available information, and do not represent the views of any employer or reflect any proprietary or internal analysis. This information should not be relied upon for making investment decisions.
No representation or warranty is made as to the accuracy, completeness, or timeliness of the information, and no liability is accepted for any loss arising directly or indirectly from its use.
All views expressed are personal, based on publicly available information, and do not represent the views of any employer or reflect any proprietary or internal analysis. This information should not be relied upon for making investment decisions.
No representation or warranty is made as to the accuracy, completeness, or timeliness of the information, and no liability is accepted for any loss arising directly or indirectly from its use.