Portfolio-Level Early Warning System
CoT portfolio-level early warning: extremes, crowding, squeeze/exhaustion, composite stress index.
Gemini Summary
Signal Summary:
- Configuration statement (mandatory): Given a spec_extreme_share_z of 0.526 and any_extreme_share_z of 1.742, this setup aligns with Range-biased price paths and Normal volatility, where the dominant risk is Mean reversion, not Regime shift.
- The signal currently resides in a Normal regime following a fleeting period of Elevated risk in late May. (1)
- Conviction Band: Low; Interpretation Confidence: High Confidence; Internal Conflict Flag: No. Signal Stability Assessment: Stable, Threshold Proximity: Moderate, Revision Sensitivity: Low.
Methodology Applied:
- Early Warning Index (EWI) values between -0.5 and 0.5 denote a Normal regime with balanced positioning. (1)
- Rising EWI values indicate a transition toward risk-off or high-volatility regimes. (1)
- Portfolio-Level Early Warning System (Data Date: 2026-06-09). (1)
Key Dynamics:
- The primary driver is the any_extreme_share_z (1.742), indicating persistent positioning imbalances despite the Normal EWI. (1)
- Stabilisation is evident as the EWI moved from 0.505 (Elevated) to 0.422 (Normal) over the last two weeks. (1)
- An internal offset exists between elevated crowded short shares (z=0.23) and compressed exhaustion shares (z=-0.09). (1)
- Conditional Invalidation: An EWI print above 0.50 would trigger an "Elevated" regime shift. (1)
- The signal shows high persistence within the Normal band, suggesting baseline risk allocations are appropriate. (1)
Scenario Balance:
- Dominant base case: Market stability persists as positioning breadth remains within non-critical thresholds. (1)
- Upside risk: Subdued volatility if squeeze risks continue to decline from recent peaks. (1)
- Downside risk: Volatility spikes if "any_extreme_share" moves further into tail territory. (1)
Time Horizon & Aggregation:
- Tactical (weeks); methodology identifies it as a lead indicator for imminent cross-asset stress. (1)
- Aggregation Weight Hint: Medium; justifies maintaining standard exposures without heavy hedging overlays. (1)
Macro Relevance:
- Informs systemic liquidity and sentiment dimensions. (1)
- The economic mechanism implies typical market functioning and balanced cross-asset positioning. (1)
- Cycle position: Not determined.
- Interacts with VIX and credit spreads to validate systemic instability regimes. (1)
Regime Context:
- Regime is persistent; the signal has spent most of the recent quarter in the Normal zone. (1)
- Direction of change is stabilising as EWI retreats from the 0.5 threshold. (1)
Model Limitations:
- CoT reporting lag (weekly data) and potential for extremes to persist in strong trends. (1)
Data & References:
Early Warning System Chart
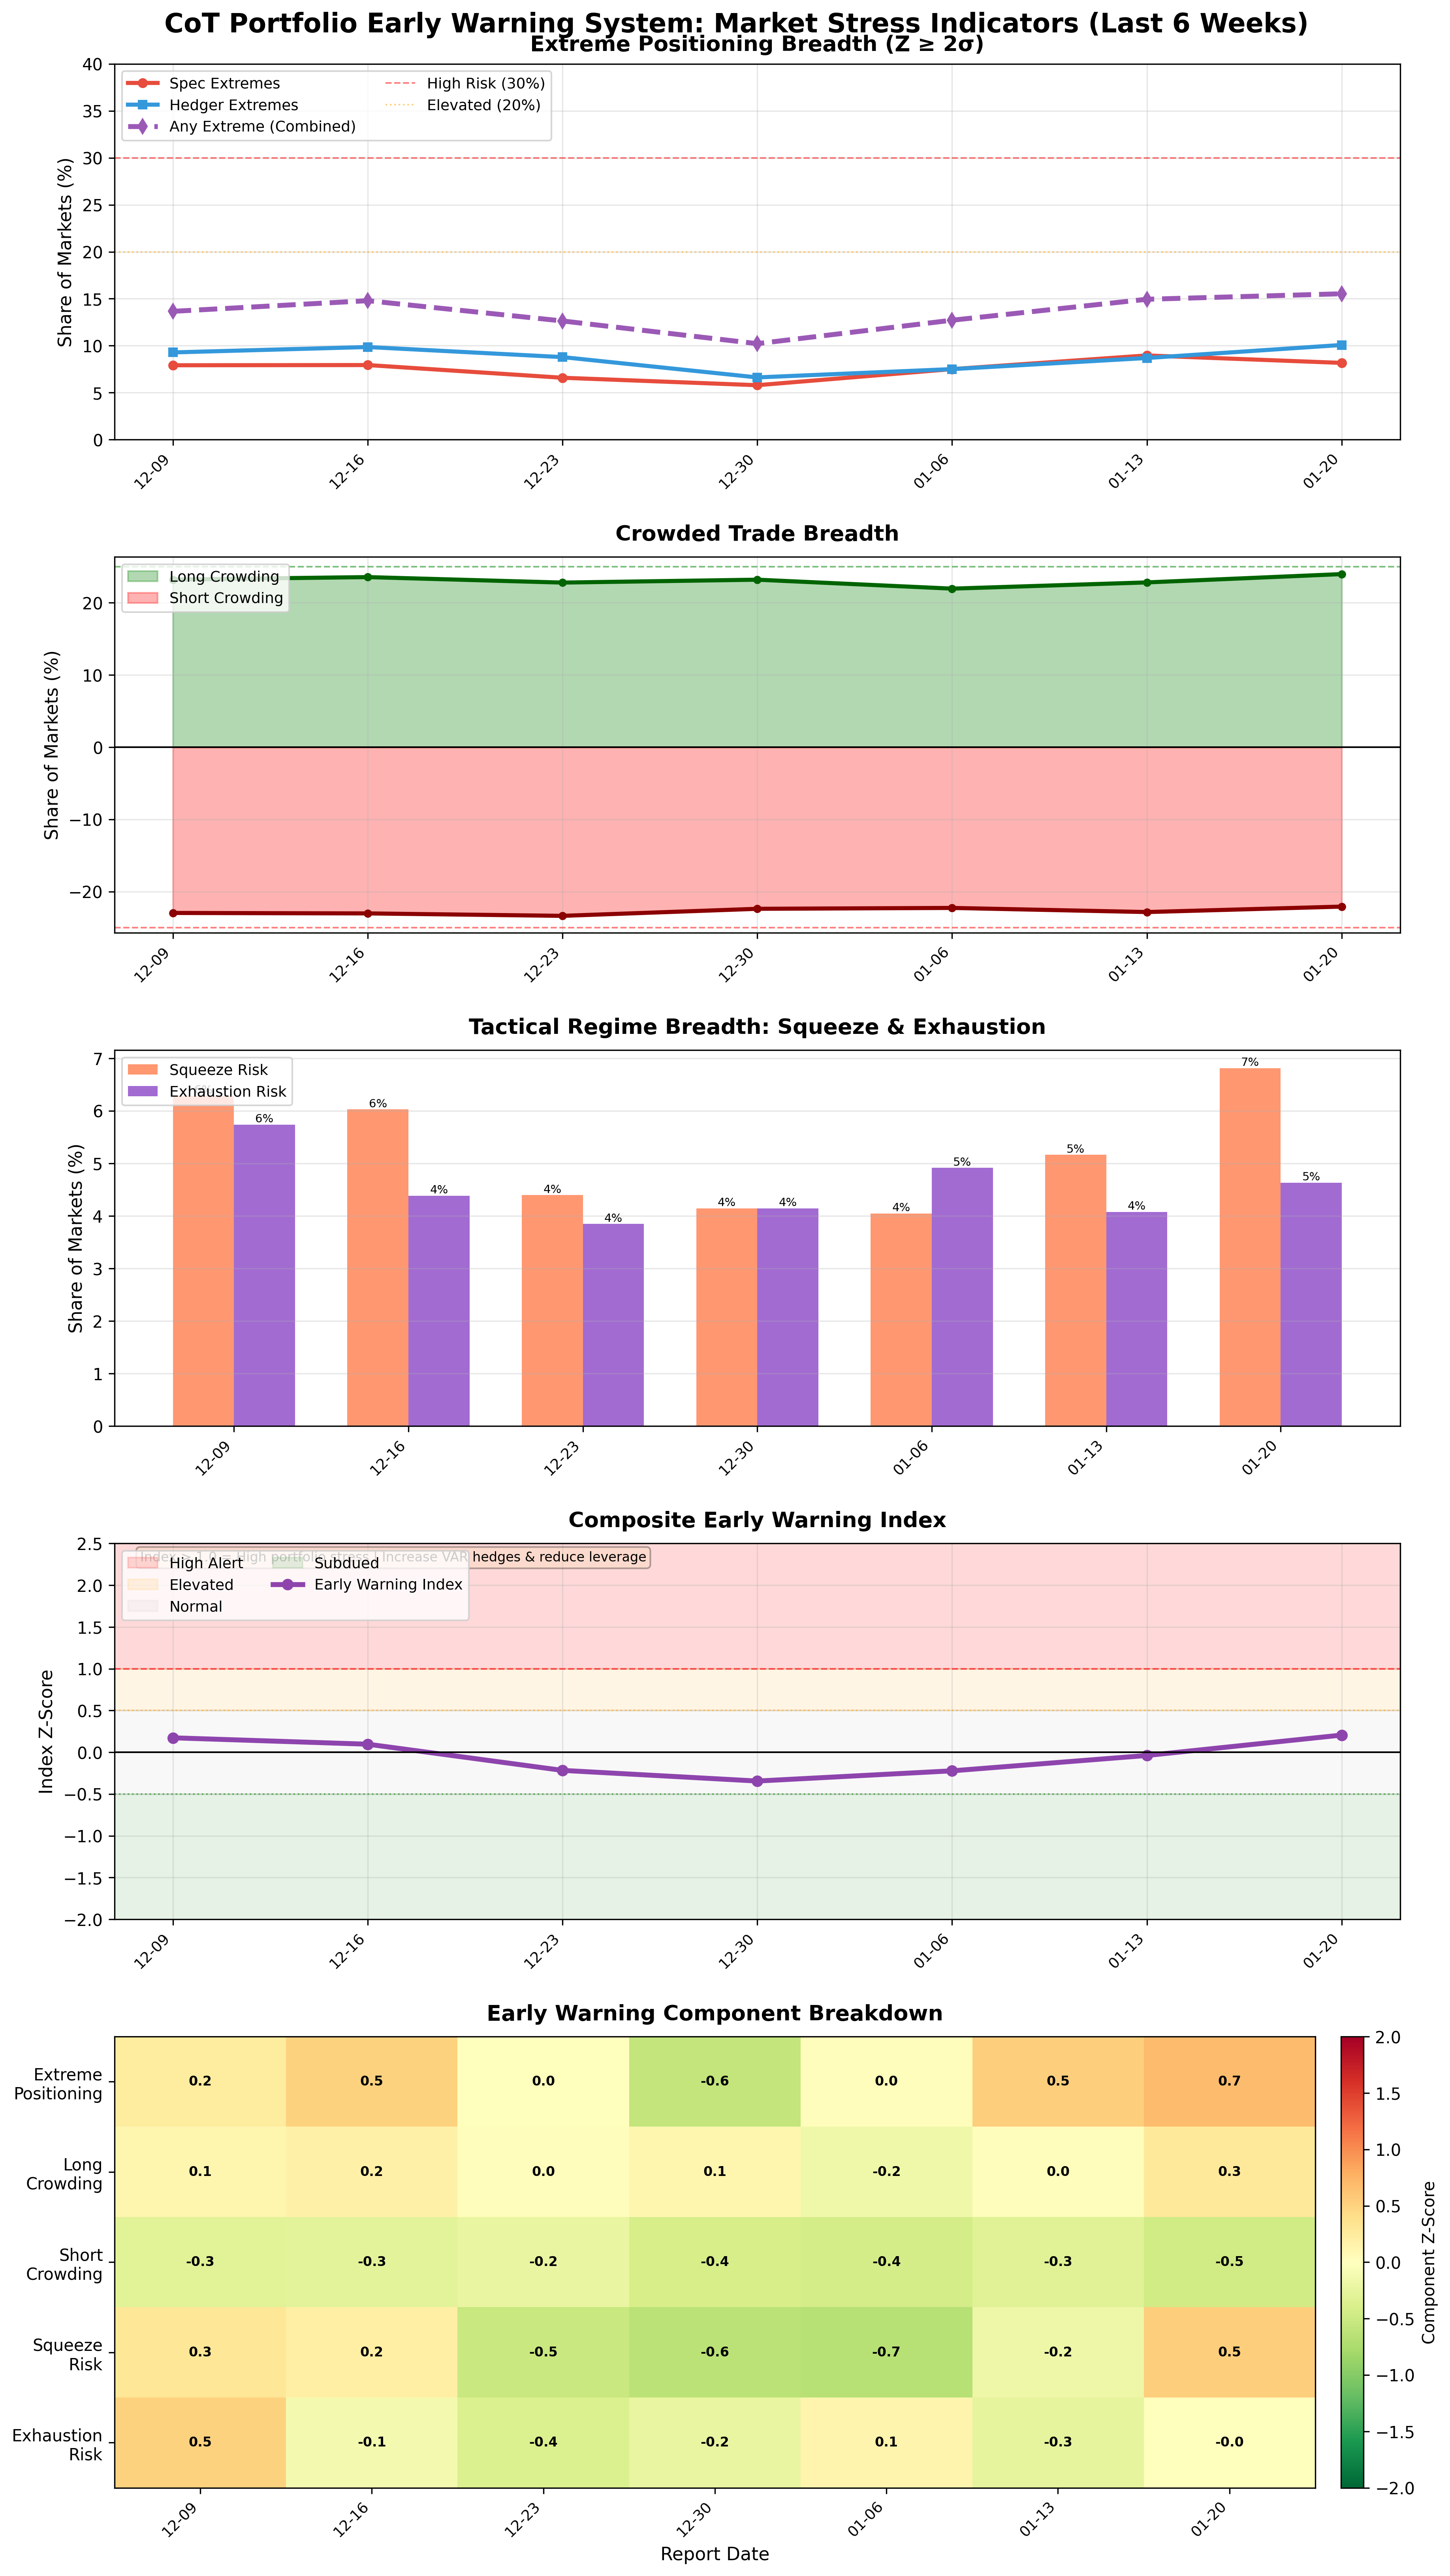
Portfolio-level stress indicators: extremes, crowding, squeeze/exhaustion, composite index.
Early Warning System Table▸
The information on this website is provided for general informational and educational purposes only and does not constitute financial, investment, legal, or tax advice. It does not take into account any individual objectives, financial situation, or needs.
All views expressed are personal, based on publicly available information, and do not represent the views of any employer or reflect any proprietary or internal analysis. This information should not be relied upon for making investment decisions.
No representation or warranty is made as to the accuracy, completeness, or timeliness of the information, and no liability is accepted for any loss arising directly or indirectly from its use.
All views expressed are personal, based on publicly available information, and do not represent the views of any employer or reflect any proprietary or internal analysis. This information should not be relied upon for making investment decisions.
No representation or warranty is made as to the accuracy, completeness, or timeliness of the information, and no liability is accepted for any loss arising directly or indirectly from its use.