M2 Money Supply Signal
M2 money supply growth as a broad liquidity indicator.
Gemini Summary
Signal Summary:
- Configuration statement: Given an M2SL Year-over-Year growth of 4.38% and 3-month momentum of 1.12%, this setup aligns with Upward-biased price paths and Indeterminate volatility, where the dominant risk is Trend continuation, not Mean reversion (1).
- The signal is currently classified as Bullish, reflecting a liquidity expansion regime that emerged in April 2025 (1).
- Conviction Band: Low; Interpretation Confidence: Mixed Signals; Internal Conflict Flag: Yes. Signal Stability: Improving; Threshold Proximity: Near; Revision Sensitivity: Moderate.
Methodology Applied:
- Bullish Regime: Triggered if YoY growth exceeds 6.0% or 3-month momentum exceeds 1.0% (1).
- Worst-of Logic: The methodology specifies a downgrade if either the YoY level or 3M momentum falls into a lower tier (1).
- Bearish Regime: Triggered if YoY growth is below 2.0% or 3-month momentum is below -1.0% (1).
- M2 Money Supply Signal (1): Latest observation July 01, 2025.
Key Dynamics:
- The primary driver is 3-month momentum (1.12%), which is currently above the 1.0% bullish threshold (1).
- YoY growth (4.38%) remains in the Neutral range (2%-6%), creating an internal conflict with the "worst-of" logic specified in the methodology (1).
- The signal has stabilized in Bullish territory over the last four months despite the YoY component lagging the 6% threshold (1).
- Conditional Invalidation: A decline in 3-month momentum below 1.0% while YoY growth remains under 6.0%.
Scenario Balance:
- Dominant base case: Continued liquidity expansion supports risk assets as momentum stays above threshold.
- Most plausible upside risk: Acceleration of YoY growth toward 6% confirming a structural expansion.
- Most plausible downside risk: Reversion to Neutral regime if short-term momentum fades below 1%.
Time Horizon & Aggregation:
- Time Horizon: Cyclical (months) as M2 serves as a leading indicator for monetary liquidity (1).
- Aggregation Weight Hint: Medium; the signal provides a directional filter for risk-on allocations but faces internal metric tension.
Macro Relevance:
- Informs broad monetary liquidity and the capacity for commercial bank credit creation (1).
- Economic mechanism: Rising momentum implies excess liquidity and expansionary bias, typically supportive of risk assets and precious metals (1).
- Cycle position: Not determined.
- Interacts with Fed balance sheet trends and inflation expectations to confirm the durability of liquidity shifts (1).
Regime Context:
- Persistence: The Bullish regime has been persistent since April 2025, marking a transition from a long Bearish period in 2023-2024 (1).
- Direction of change: Strengthening; YoY growth has improved steadily from contractionary levels to over 4% (1).
Model Limitations:
- Does not account for money velocity; correlation with CPI is variable over long horizons (1).
- Subject to reporting lags and periodic Federal Reserve revisions (1).
Data & References:
- M2 Money Supply Signal (1): Latest observation July 01, 2025 (Value: 22020.0).
- Data timeliness cannot be assessed.
- Required for depth: Federal Reserve H.4.1 (Balance Sheet) and Consumer Price Index (CPI) trends.
M2 Money Supply Chart
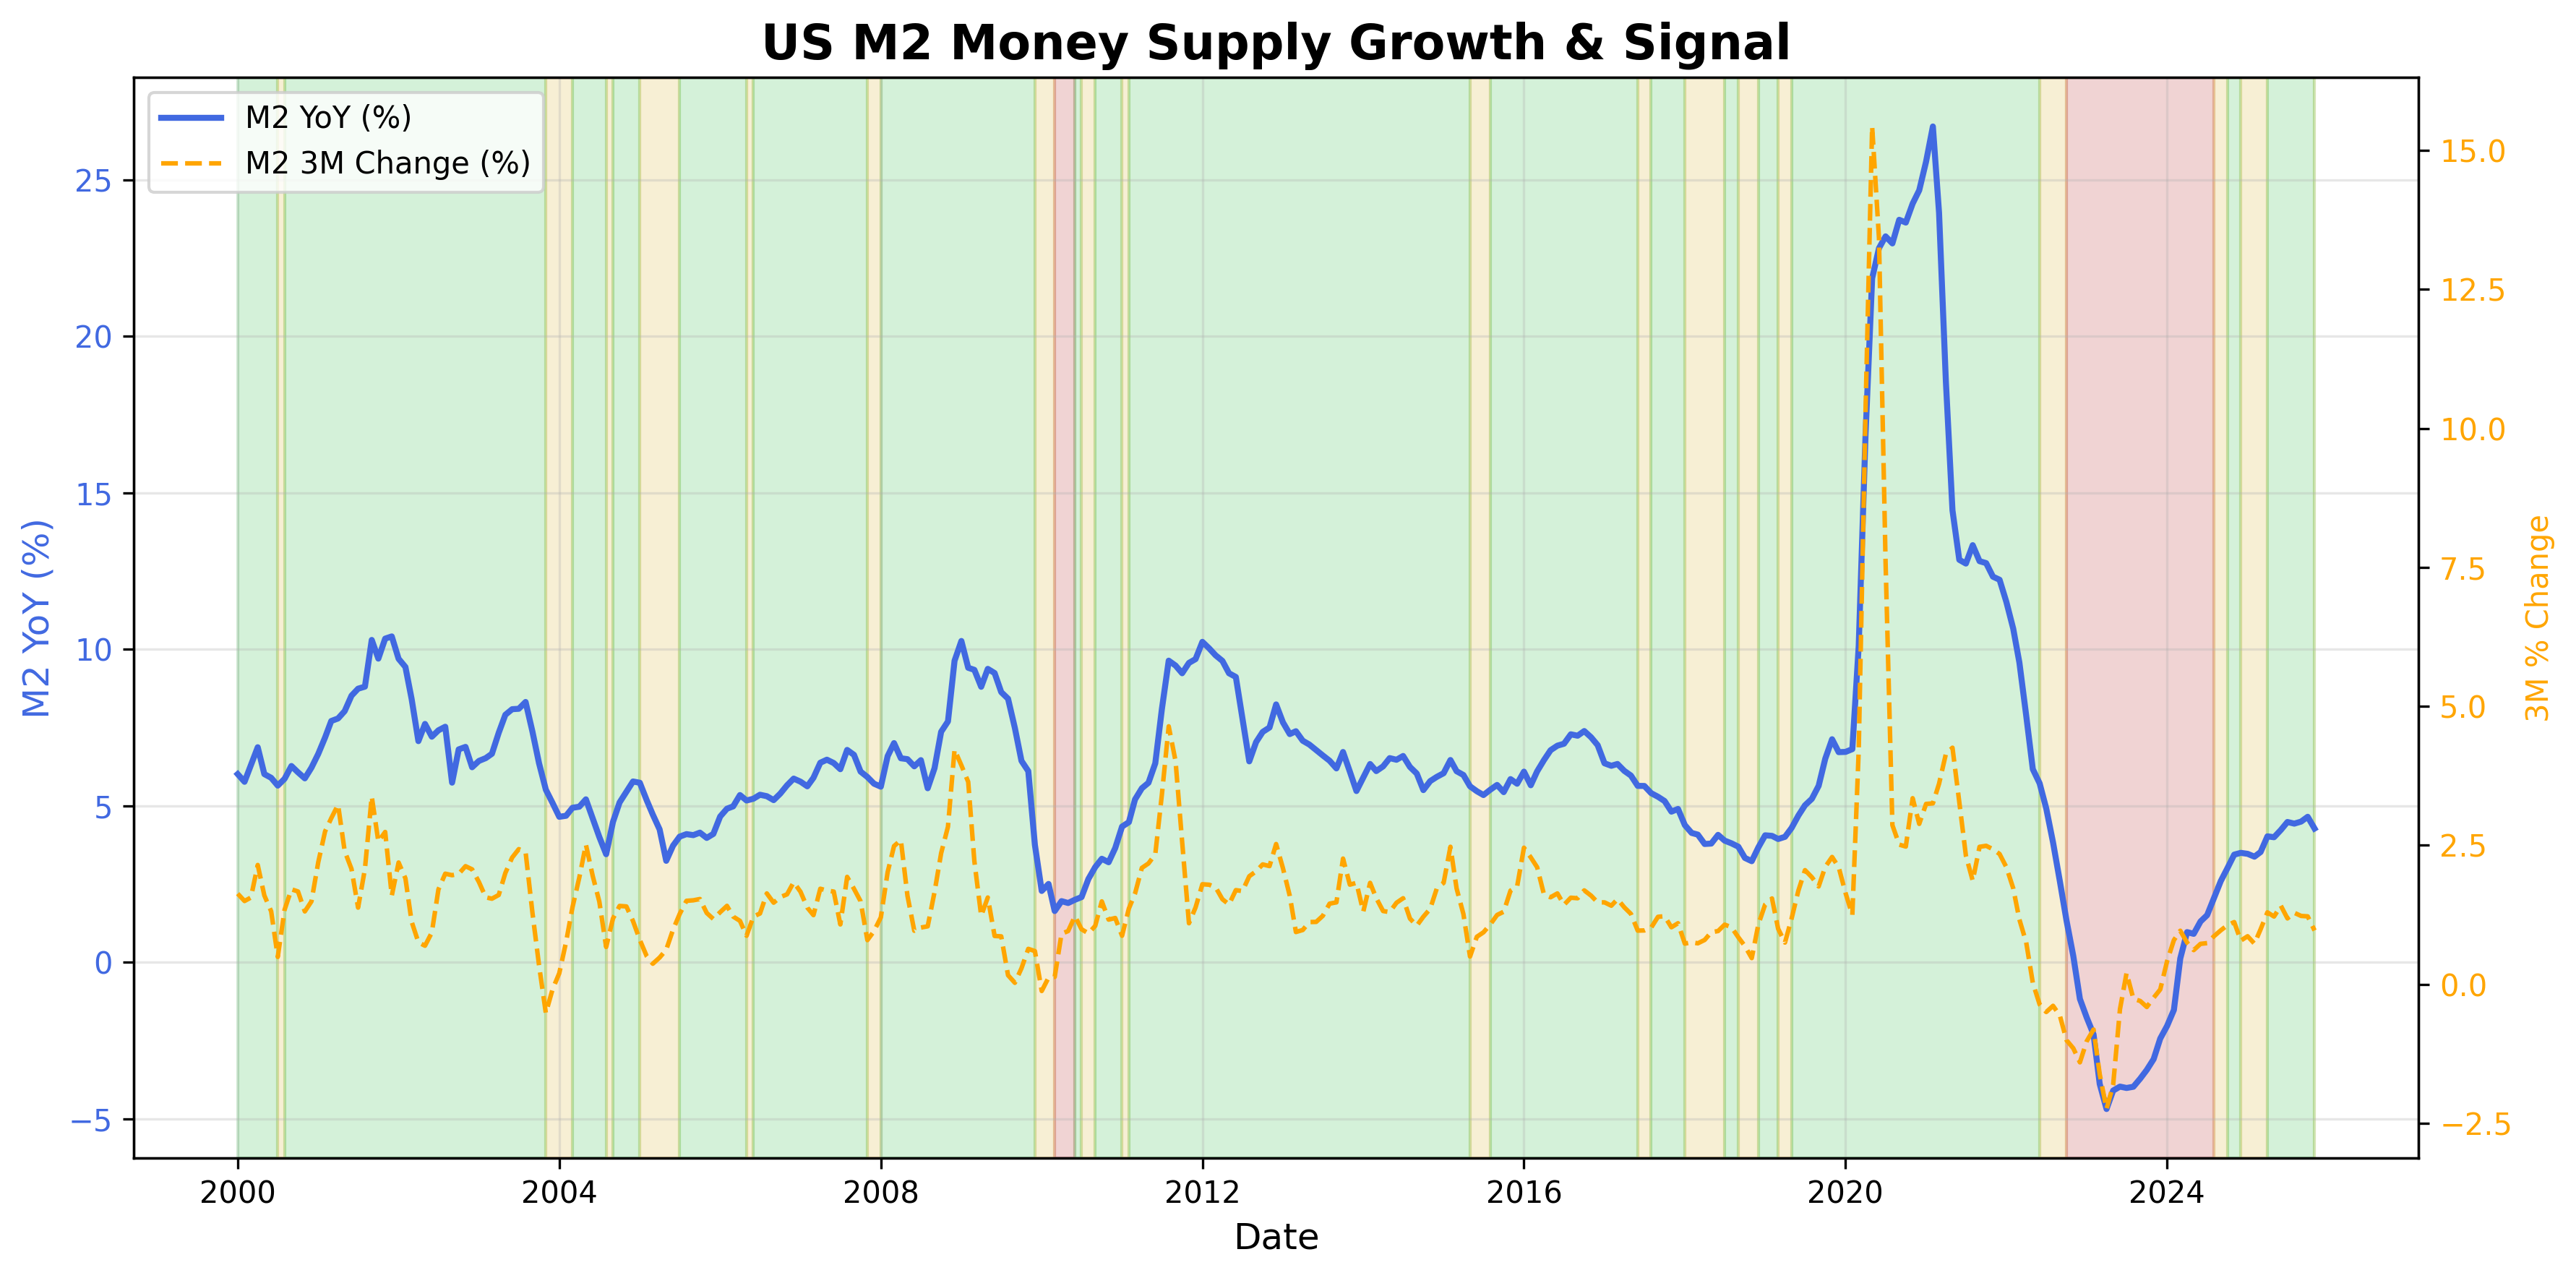
Growth in U.S. M2 money supply as a proxy for system-wide liquidity.
M2 Money Supply Table▸
The information on this website is provided for general informational and educational purposes only and does not constitute financial, investment, legal, or tax advice. It does not take into account any individual objectives, financial situation, or needs.
All views expressed are personal, based on publicly available information, and do not represent the views of any employer or reflect any proprietary or internal analysis. This information should not be relied upon for making investment decisions.
No representation or warranty is made as to the accuracy, completeness, or timeliness of the information, and no liability is accepted for any loss arising directly or indirectly from its use.
All views expressed are personal, based on publicly available information, and do not represent the views of any employer or reflect any proprietary or internal analysis. This information should not be relied upon for making investment decisions.
No representation or warranty is made as to the accuracy, completeness, or timeliness of the information, and no liability is accepted for any loss arising directly or indirectly from its use.