Labour Market Momentum Signal
Labour market momentum: jobless claims and payroll growth dynamics.
Gemini Summary
Signal Summary:
- Configuration statement (mandatory): Given a Labor_Momentum composite of 0.776 and a Z_ICSA of 0.132, this setup aligns with Upward-biased price paths and Normal volatility, where the dominant risk is a Regime shift, not trend continuation (1).
- The signal remains in a Tightening regime, though momentum has decelerated for three consecutive months as it approaches the neutral threshold (1).
- Conviction Band: Medium; Interpretation Confidence: High Confidence; Internal Conflict Flag: No. Signal Stability Assessment: Deteriorating; Threshold Proximity: Near; Revision Sensitivity: Moderate.
Methodology Applied:
- A composite value above 0.75 defines the Tightening regime, implying broad labour improvement and easing layoffs (1).
- Directionality rule: Rising values imply expansion and risk-on bias; falling values imply a cyclical slowdown (1).
- Investment implication for Tightening: Labour supports growth; monitor for late-cycle overheating if inflation is firm (1).
- Labour Market Momentum Signal (latest observation: 2026-06-30).
Key Dynamics:
- The primary driver is the softening of Initial Jobless Claims (Z_ICSA), which fell from 0.638 in May to 0.132 in June (1).
- Momentum is currently fading, with the composite dropping from a peak of 0.930 in April to 0.776 today (1).
- Conditional Invalidation: The signal reverts to Neutral if the composite falls below the 0.75 threshold (1).
- Signal stability is deteriorating as the leading indicator (claims) shows rapid mean reversion.
Scenario Balance:
- Base case dominant: Persistent Tightening supports growth, though at a diminishing rate of improvement (1).
- Upside risk: A re-acceleration in hiring (PAYEMS) that stabilizes the composite above 0.80 (1).
- Downside risk: A transition to Neutral if Initial Claims continue to rise, signaling a cyclical peak (1).
Time Horizon & Aggregation:
- Time Horizon: Cyclical (months), reflecting the duration of hiring and layoff cycles (1).
- Aggregation Weight Hint: High, as labour momentum is a primary driver of the broader economic growth block (1).
Macro Relevance:
- Informs the Demand and Pricing macro dimensions by tracking household income support through employment (1).
- Transmission mechanism: Strong hiring (low claims/high payrolls) fuels consumption, whereas softening momentum suggests fading demand impulse (1).
- Cycle position: Not determined.
Regime Context:
- Persistence: The signal has maintained the Tightening regime for three months since transitioning from Neutral in April 2026.
- Direction of change: Weakening.
Model Limitations:
- Weekly claims data is inherently volatile and payrolls are subject to significant monthly revisions (1).
- Policy changes can distort claims levels, complicating the identification of turning points (1).
Data & References:
Labour Market Momentum Chart
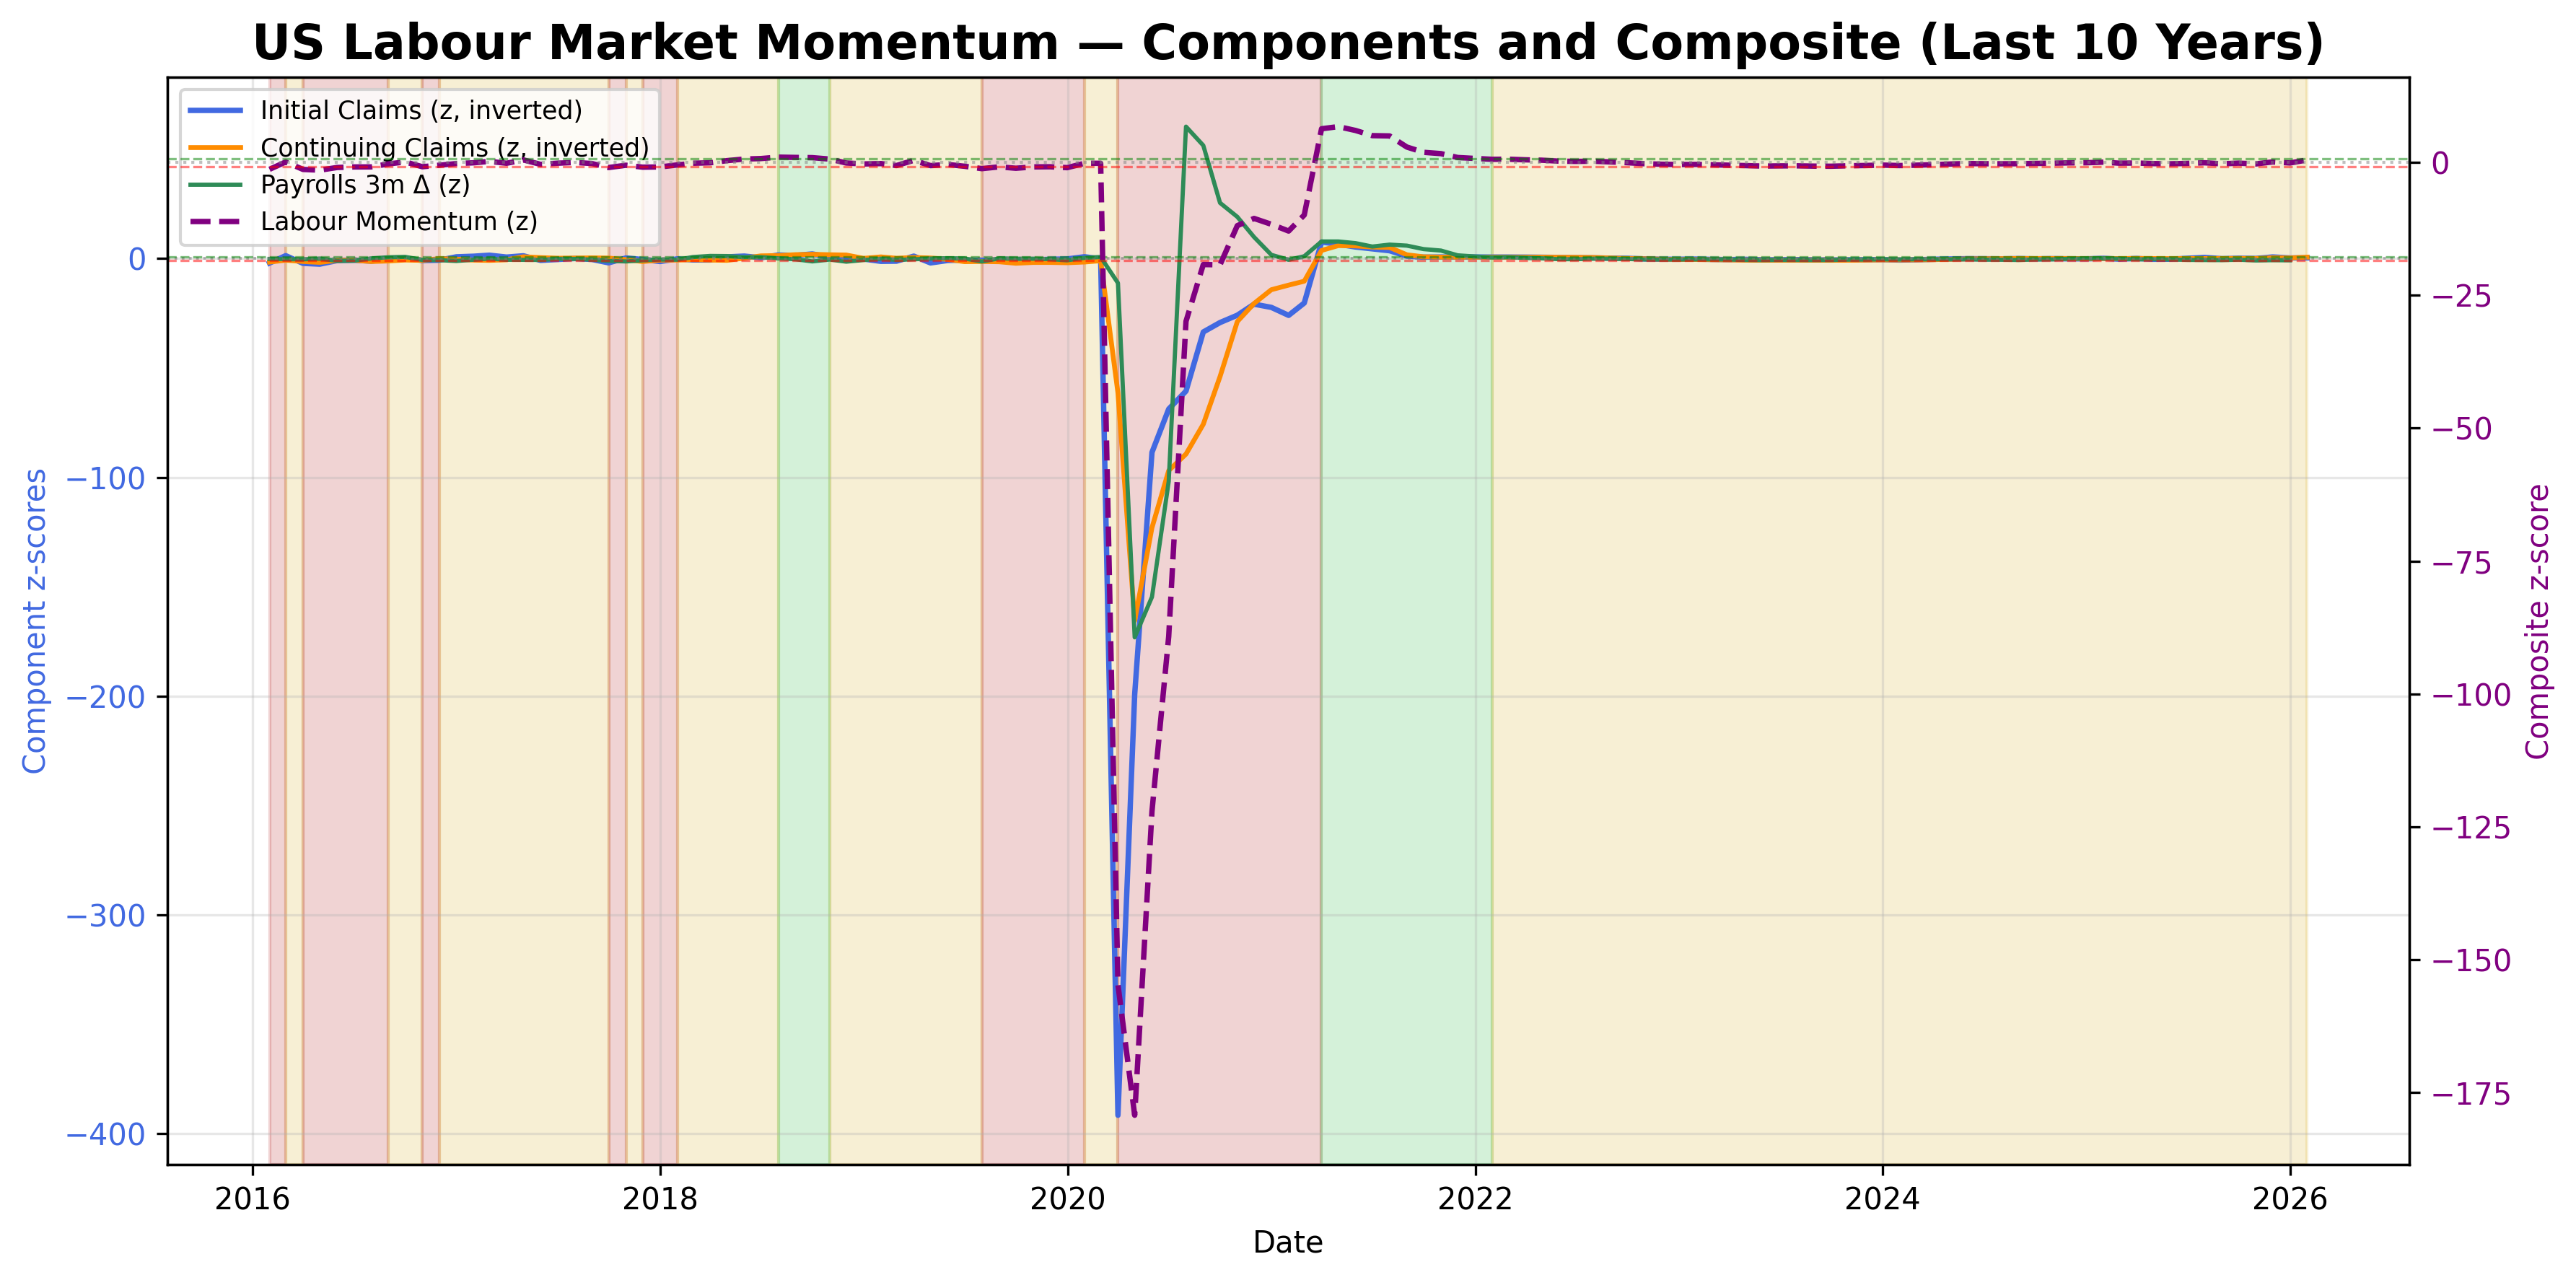
Composite of jobless claims and payroll momentum.
Labour Market Momentum Table▸
The information on this website is provided for general informational and educational purposes only and does not constitute financial, investment, legal, or tax advice. It does not take into account any individual objectives, financial situation, or needs.
All views expressed are personal, based on publicly available information, and do not represent the views of any employer or reflect any proprietary or internal analysis. This information should not be relied upon for making investment decisions.
No representation or warranty is made as to the accuracy, completeness, or timeliness of the information, and no liability is accepted for any loss arising directly or indirectly from its use.
All views expressed are personal, based on publicly available information, and do not represent the views of any employer or reflect any proprietary or internal analysis. This information should not be relied upon for making investment decisions.
No representation or warranty is made as to the accuracy, completeness, or timeliness of the information, and no liability is accepted for any loss arising directly or indirectly from its use.