Job Flows Signal
Job flows signal: tracking hires, separations and net flows in the labour market.
Gemini Summary
Signal Summary:
- Configuration statement: Given a Net Job Creation of -159 and a Composite z-score of -0.417, this setup aligns with Transition-biased price paths and Indeterminate volatility, where the dominant risk is Regime shift, not Mean reversion (1).
- the signal currently resides in a NEUTRAL regime but is trending toward the COOL threshold as firm-level dynamism erodes (1).
- Conviction Band: Medium; Interpretation Confidence: High Confidence; Internal Conflict Flag: No. Signal Stability Assessment: Deteriorating; Threshold Proximity: Moderate; Revision Sensitivity: High.
Methodology Applied:
- Falling Net_z despite stable Gross Gains: Signals that increasing job destruction is beginning to offset hiring activity, suggesting structural weakening (1).
- Composite z-score < -0.75 (COOL): Indicates waning labor churn and a rising risk of economic slowdown or contraction (1).
- Falling values: Methodology defines these as implying labor market slowdown and risk-off sentiment transitions (1).
- Dataset: BLS Business Dynamics Statistics (BDS) via Job Flows Signal, last observed 2025-09-30 (1).
Key Dynamics:
- The primary driver is the contraction in Net Job Creation (-159) and the collapse of the Labor Dynamism 4Q MA to 9.00 from historical highs (1).
- Momentum is clearly negative; the Net_z (-0.55) is descending more rapidly than Gross Gains_z, indicating a destruction-led slowdown (1).
- Conditional Invalidation: A reversal where Composite z-score rises above 0.75 would signal a shift to a HOT (expansionary) regime (1).
- Persistence: The signal has remained NEUTRAL for eight consecutive quarters, but the recent trajectory shows consistent deterioration in dynamism (1).
Scenario Balance:
- Base case dominant: Continued transition toward a COOL regime as net job destruction persists.
- Upside risk: Stabilization of hiring (Gross Gains) without further increases in losses, potentially returning the signal to a neutral-positive trend.
- Downside risk: A breach of the -0.75 z-score threshold, triggering a formal COOL regime and defensive investment implications (1).
Time Horizon & Aggregation:
- Time Horizon: Cyclical (months); quarterly data and 4Q moving averages capture structural shifts rather than tactical noise (1).
- Aggregation Weight Hint: Medium; serves as a structural anchor to validate high-frequency payroll data (1).
Macro Relevance:
- Macro dimension: Labor market liquidity and private sector demand impulse (1).
- Economic mechanism: Waning labor churn reduces consumer income security and firm-level expansion capacity, typical of a late-cycle transition (1).
- Cycle position: Not determined, though methodology flags falling Net_z as a cautionary transition sign (1).
Regime Context:
- Regime persistence: Persistent NEUTRAL state since Q4 2023 (1).
- Direction of change: Weakening; the signal is trending away from the 0.0 midline toward the COOL threshold (1).
Model Limitations:
- Quarterly frequency causes reporting lags and the signal is subject to significant BLS revisions (1).
Data & References:
Job Flows Signal Chart
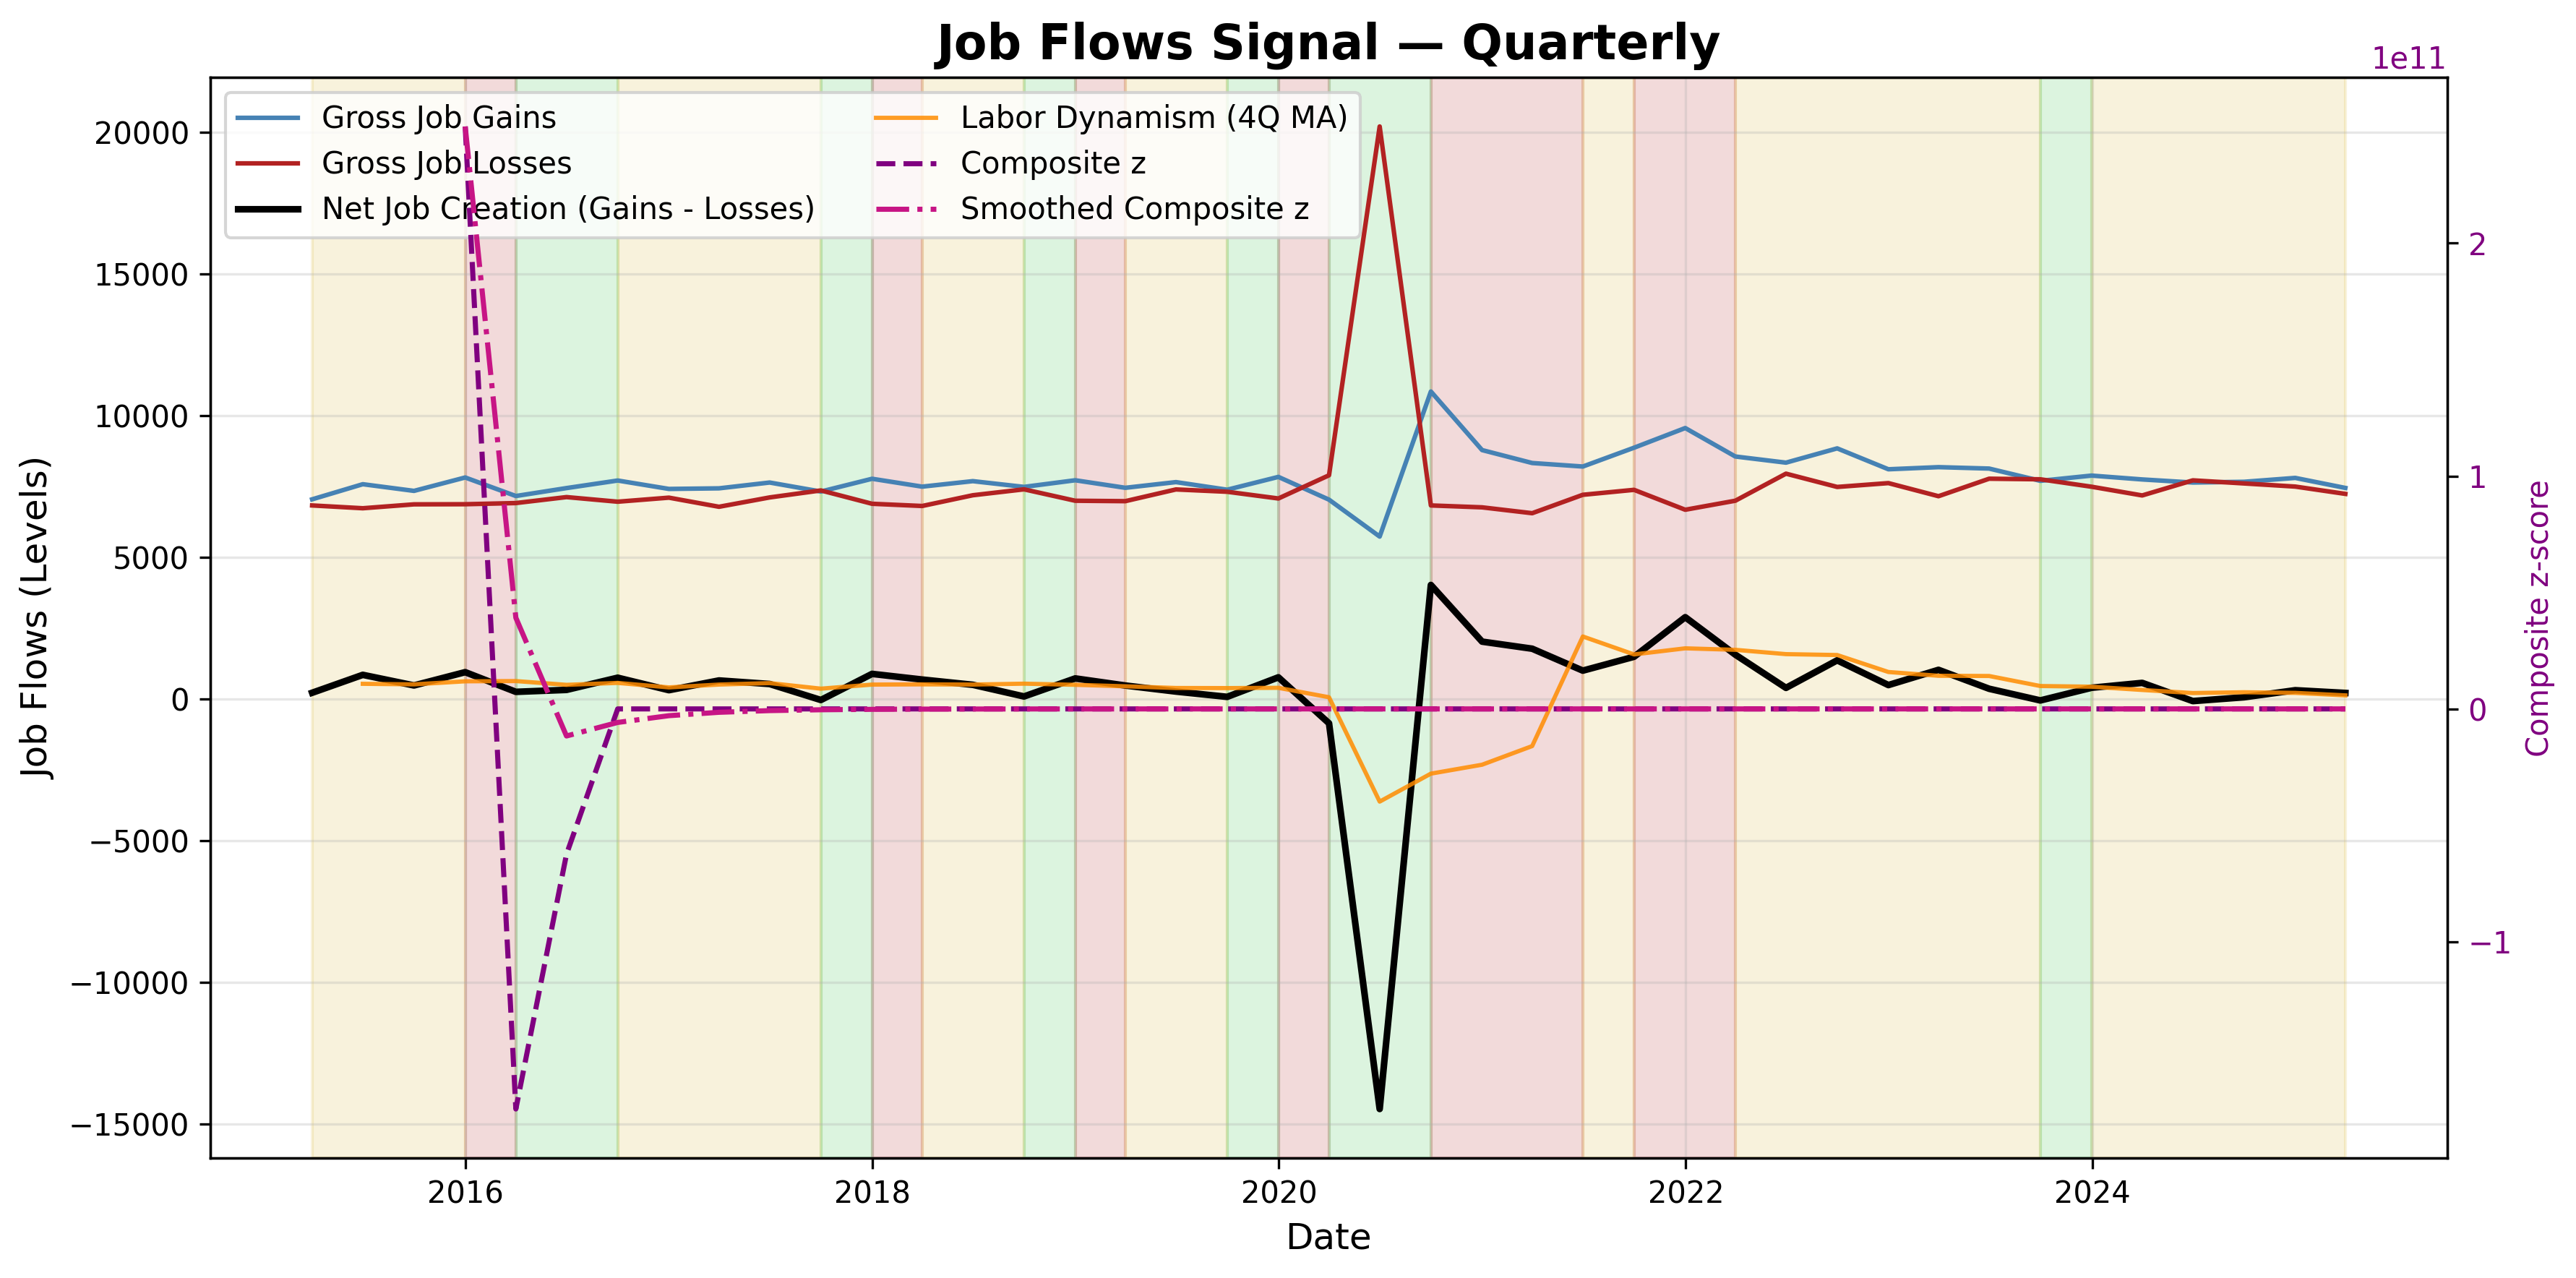
Job flows: hires, separations and net flows across the labour market.
Job Flows Signal Table▸
The information on this website is provided for general informational and educational purposes only and does not constitute financial, investment, legal, or tax advice. It does not take into account any individual objectives, financial situation, or needs.
All views expressed are personal, based on publicly available information, and do not represent the views of any employer or reflect any proprietary or internal analysis. This information should not be relied upon for making investment decisions.
No representation or warranty is made as to the accuracy, completeness, or timeliness of the information, and no liability is accepted for any loss arising directly or indirectly from its use.
All views expressed are personal, based on publicly available information, and do not represent the views of any employer or reflect any proprietary or internal analysis. This information should not be relied upon for making investment decisions.
No representation or warranty is made as to the accuracy, completeness, or timeliness of the information, and no liability is accepted for any loss arising directly or indirectly from its use.