Inflation Term-Structure Signal
Inflation term-structure: breakevens and real yields across the 5-10 year horizon.
Gemini Summary
Signal Summary:
- Configuration statement (mandatory): Given a composite score of -0.224, Z_T5 of -0.156, and Z_mReal of -0.201, this setup aligns with Range-biased price paths and Normal volatility, where the dominant risk is Mean reversion, not Regime shift.
- The signal remains in a persistent Neutral regime as inflation and real rate conditions stay within normal historical bands. (1)
- Conviction Band: Low; Interpretation Confidence: High Confidence; Internal Conflict Flag: No. Signal Stability Assessment: Volatile; Threshold Proximity: Far; Revision Sensitivity: Unknown.
Methodology Applied:
- A Composite value between -0.75 and 0.75 defines a Neutral regime. (1)
- The composite weights 5Y Breakevens (0.4), 10Y Breakevens (0.3), and 10Y Real TIPS yields (0.3). (1)
- Rising values imply a transition toward reflation and easier financial conditions. (1)
- Inflation Term-Structure Signal latest observation: 2026-06-30. (1)
Key Dynamics:
- The current Neutral state is driven by a composite score of -0.224, well within the +/- 0.75 threshold. (1)
- Recent momentum shows a reversal from the April peak (0.596) toward a more negative bias. (1)
- Internal dynamics show slightly tighter real conditions (Z_mReal -0.201) offsetting low inflation compensation (Z_T10 -0.337). (1)
- Conditional Invalidation: An Absolute Composite score exceeding 0.75 would trigger a regime shift. (1)
- Signal stability is low, characterized by frequent oscillations within the Neutral band over the last 12 months. (1)
Scenario Balance:
- Dominant base case: Continued Neutral regime as breakevens and real yields oscillate without clear trend.
- Most plausible upside risk: Reflation trigger via a significant rise in 5Y inflation compensation. (1)
- Most plausible downside risk: Disinflation trigger if real yields rise while breakevens compress further. (1)
Time Horizon & Aggregation:
- Time Horizon: Cyclical (months) based on the 5-year rolling historical norm logic. (1)
- Aggregation Weight Hint: Low; Neutral regimes serve as weak conditioning variables for macro tilts. (1)
Macro Relevance:
- Macro dimension informed: Pricing and real financial conditions. (1)
- Economic mechanism: Measures market-implied inflation expectations and the degree of real-rate easing or tightening. (1)
- Cycle position: Not determined.
- Interacts with commodity price trends and survey-based inflation expectations to confirm regime shifts. (1)
Regime Context:
- Persistent Neutral regime, maintained since the inception of the provided data series. (1)
- Direction of change: Weakening (moving from near-reflation in April back toward a neutral-negative stance). (1)
Model Limitations:
- TIPS liquidity premia can distort breakevens during periods of high market stress. (1)
- Constant-maturity estimates used in calculations are subject to revisions. (1)
Data & References:
Inflation Term-Structure Chart
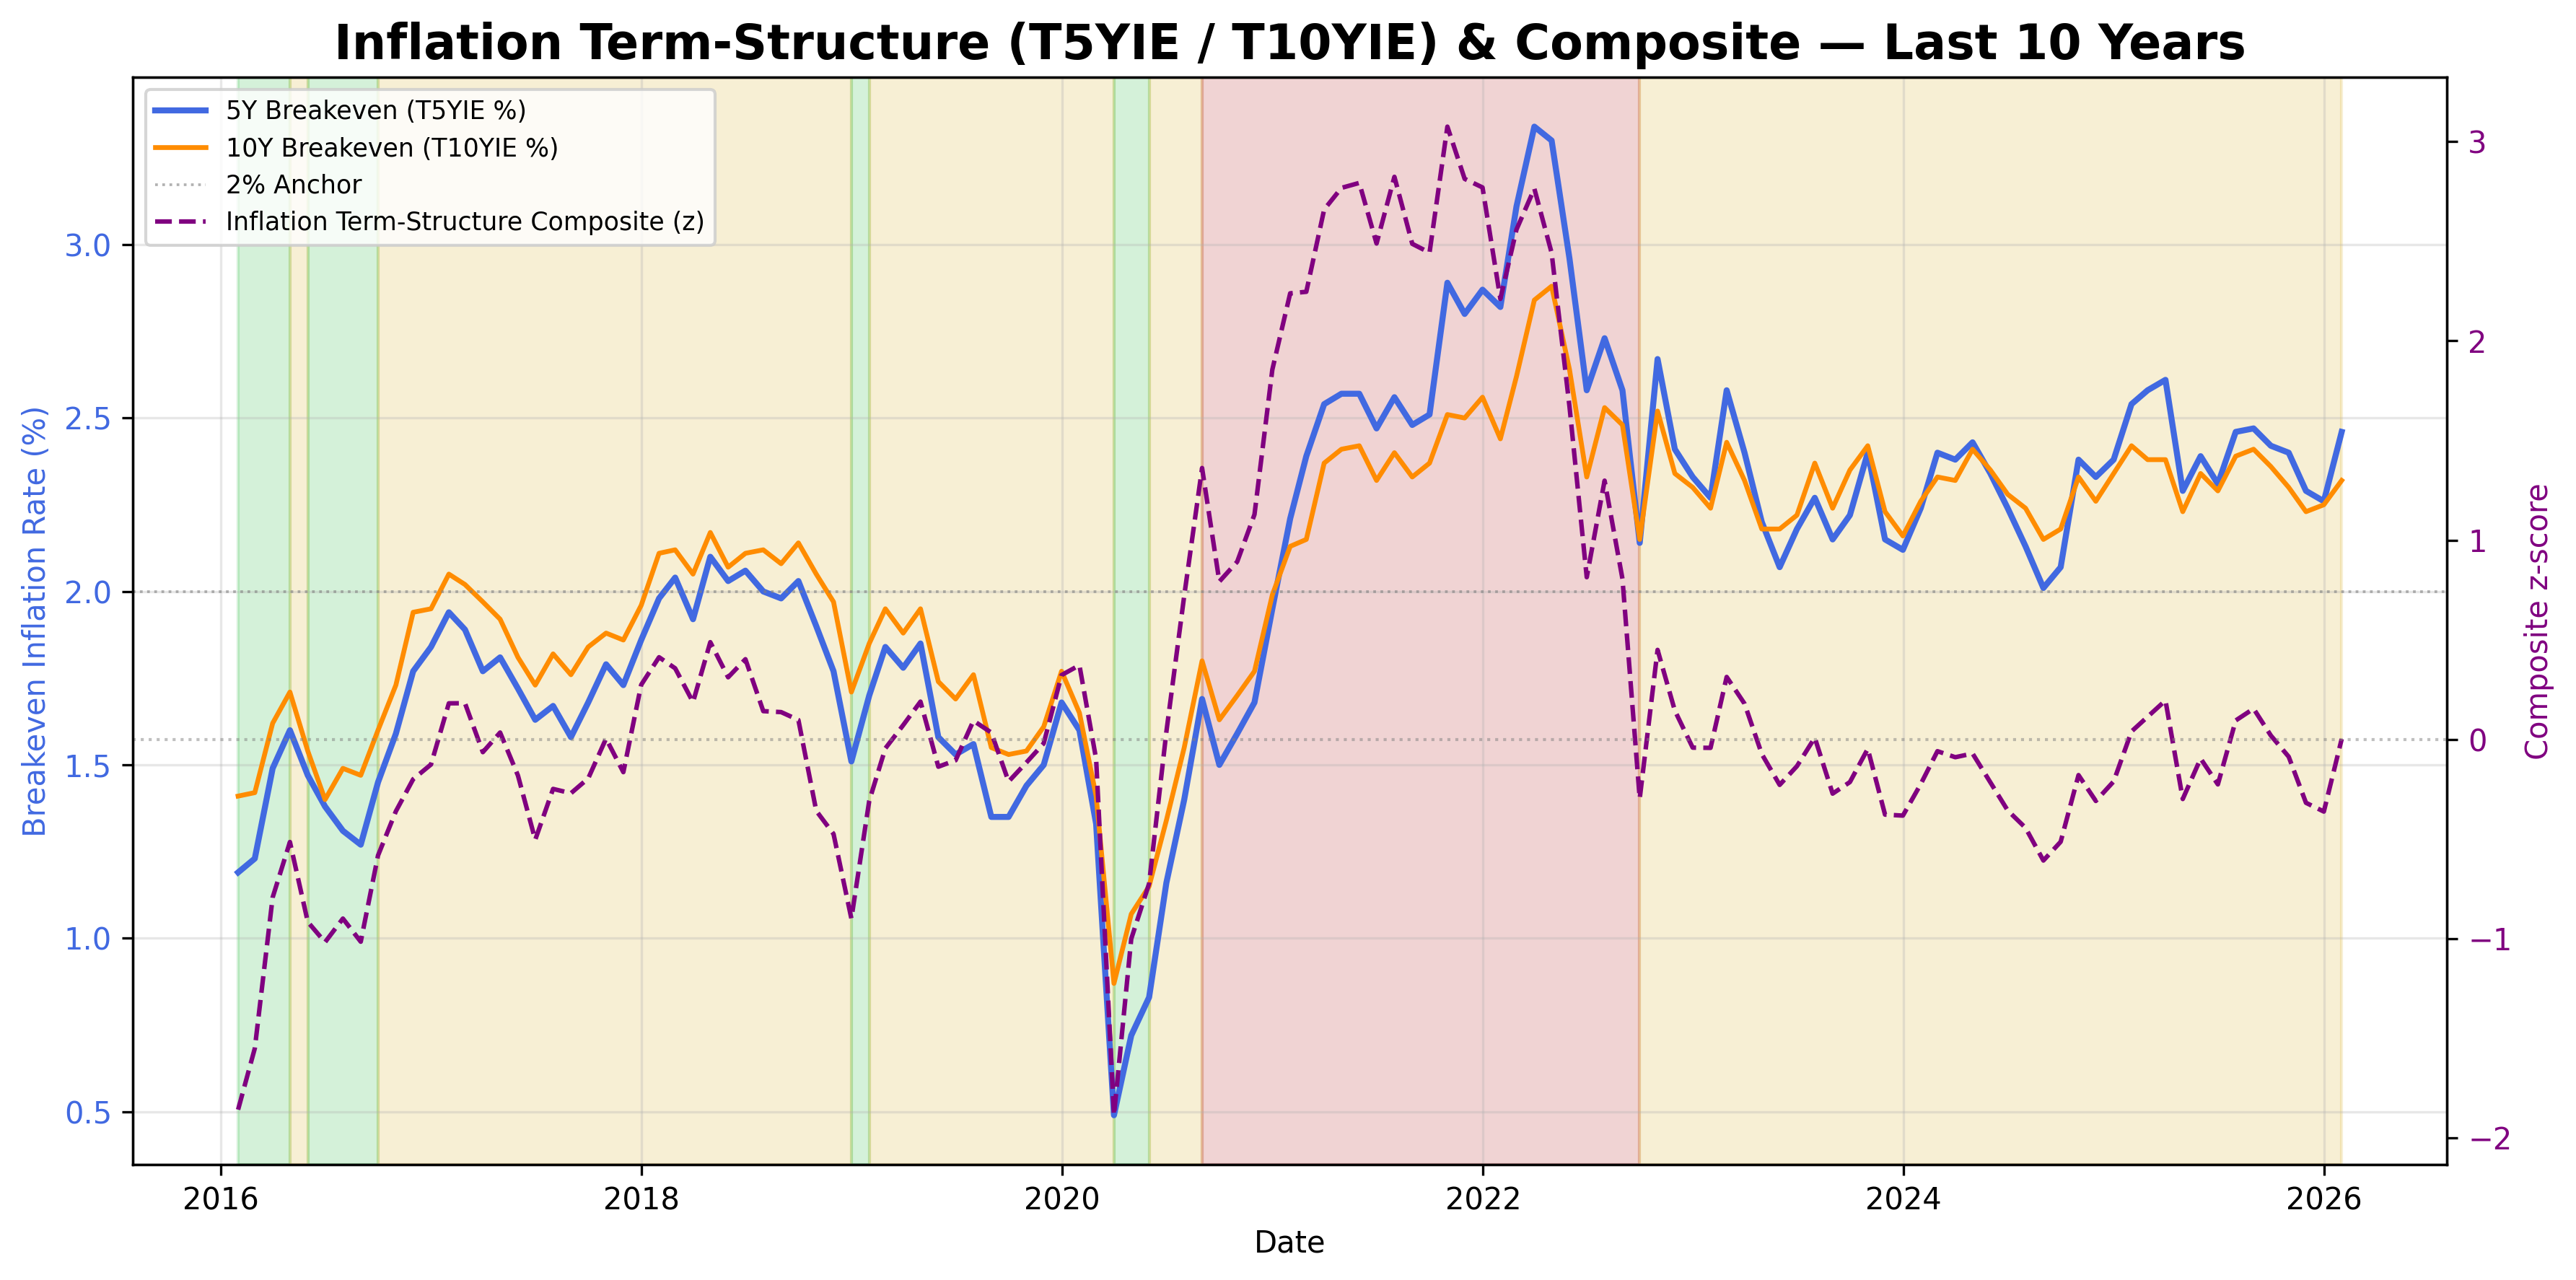
Inflation term-structure composite from 5y/10y breakevens and 10y real yields.
Inflation Term-Structure Table▸
The information on this website is provided for general informational and educational purposes only and does not constitute financial, investment, legal, or tax advice. It does not take into account any individual objectives, financial situation, or needs.
All views expressed are personal, based on publicly available information, and do not represent the views of any employer or reflect any proprietary or internal analysis. This information should not be relied upon for making investment decisions.
No representation or warranty is made as to the accuracy, completeness, or timeliness of the information, and no liability is accepted for any loss arising directly or indirectly from its use.
All views expressed are personal, based on publicly available information, and do not represent the views of any employer or reflect any proprietary or internal analysis. This information should not be relied upon for making investment decisions.
No representation or warranty is made as to the accuracy, completeness, or timeliness of the information, and no liability is accepted for any loss arising directly or indirectly from its use.