Industrial Production Signal
Industrial production growth as a real-economy activity signal.
Gemini Summary
Signal Summary:
- Configuration statement: Given an INDPRO YoY of 1.67% and RIWG21222S growth of 17.77%, this setup aligns with Indeterminate price paths and Indeterminate volatility, where the dominant risk is Data uncertainty, not Trend continuation, as values remain below the 2% bullish threshold (1).
- The signal is in a persistent Neutral regime, indicating a state of flux where growth is positive but lacks the magnitude for a pro-cyclical breakout (1).
- Conviction Band: Low; Interpretation Confidence: Low Confidence; Internal Conflict Flag: Yes. Signal Stability Assessment: Improving; Threshold Proximity: Near; Revision Sensitivity: High.
Methodology Applied:
- Regimes are Bullish only when INDPRO YoY > 2% and momentum is positive with at least one confirmer (1).
- Mixed growth and momentum signals imply a Neutral state where outcome dispersion is high (1).
- Mining share (RIWG21222S) serves as a structural modifier for confidence rather than a primary regime trigger (1).
- Industrial Production Index (INDPRO), observed 2026-05-01 (1).
Key Dynamics:
- Main driver is INDPRO YoY at 1.67%, which has improved from 0.58% in three months but remains below the 2% threshold (1).
- Momentum is positive, but the absence of external confirmers prevents a bullish transition (1).
- Internal Tension: Rising hard data momentum is not yet validated by the methodology’s required leading indicators (1).
- Conditional Invalidation: INDPRO YoY growth exceeding 2% with positive confirmers (1).
- The signal has shown directional improvement since early 2026 but remains stable within the Neutral band (1).
Scenario Balance:
- Base case dominant: Continued Neutral regime as INDPRO growth stabilises below the expansionary threshold.
- Upside secondary: Transition to Bullish triggered by INDPRO YoY > 2% and rising new orders.
- Downside residual: Transition to Bearish if INDPRO YoY turns negative while mining shares rise.
Time Horizon & Aggregation:
- Time Horizon: Cyclical (months) as the signal measures medium-term industrial cycle phases (1).
- Aggregation Weight Hint: Low due to the Neutral status and lack of provided confirmer data (1).
Macro Relevance:
- Informs the real-sector output dimension and industrial demand levels (1).
- Economic mechanism: Rising production implies expansionary pressure and pro-cyclical risk appetite (1).
- Cycle position: Not determined.
- Typically triangulated with liquidity signals and ISM New Orders to confirm directional shifts (1).
Regime Context:
- Regime persistence: Neutral since June 2025 (1).
- Direction of change: Improving momentum but failing to clear structural thresholds (1).
Model Limitations:
- INDPRO is subject to significant annual benchmark revisions which may alter historical regime labels (1).
- The mining share component is quarterly and slow-moving, potentially lagging real-time shifts (1).
Data & References:
Industrial Production Chart
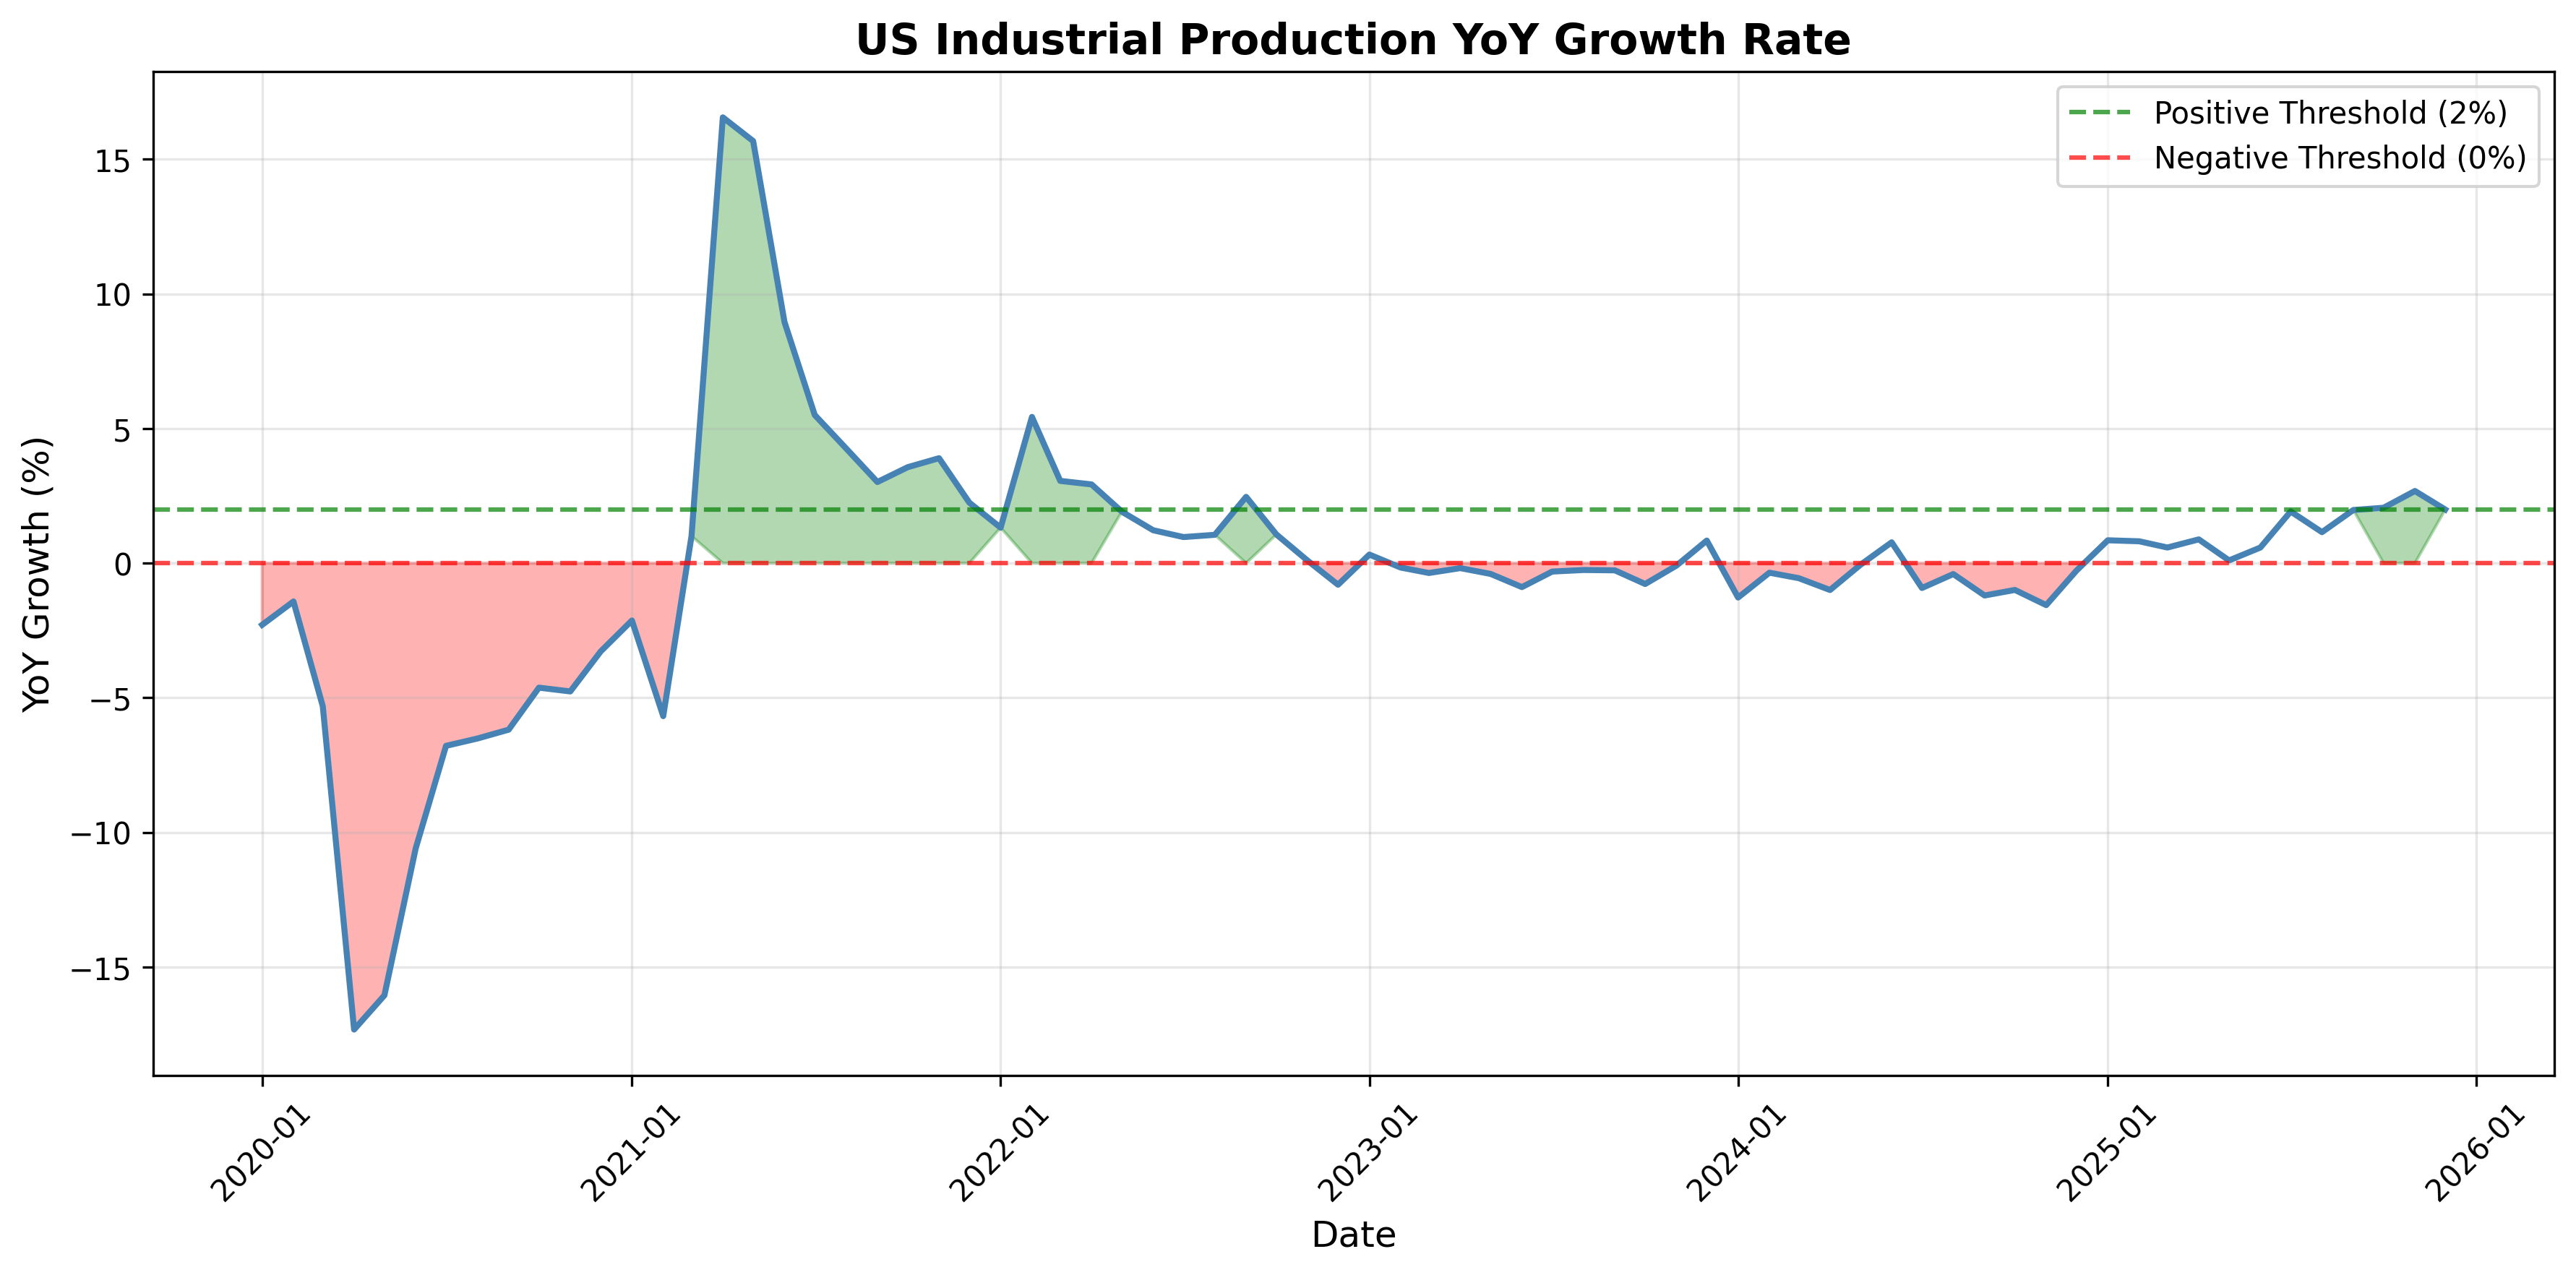
Year-over-year growth in U.S. industrial production.
Industrial Production Table▸
The information on this website is provided for general informational and educational purposes only and does not constitute financial, investment, legal, or tax advice. It does not take into account any individual objectives, financial situation, or needs.
All views expressed are personal, based on publicly available information, and do not represent the views of any employer or reflect any proprietary or internal analysis. This information should not be relied upon for making investment decisions.
No representation or warranty is made as to the accuracy, completeness, or timeliness of the information, and no liability is accepted for any loss arising directly or indirectly from its use.
All views expressed are personal, based on publicly available information, and do not represent the views of any employer or reflect any proprietary or internal analysis. This information should not be relied upon for making investment decisions.
No representation or warranty is made as to the accuracy, completeness, or timeliness of the information, and no liability is accepted for any loss arising directly or indirectly from its use.