Housing Lead Signal
Housing lead indicator: permits, starts momentum, and mortgage headwinds.
Gemini Summary
Signal Summary:
- Configuration statement: Given the combination of declining PERMIT (1413) and sharply lower HOUST (-1.28 Z-score), this setup aligns with Range-biased price paths and Normal volatility, where the dominant risk is a Regime shift toward contraction, not trend continuation (1).
- The signal is currently in a Neutral regime, having transitioned from "Expanding" in February 2026 (1).
- Conviction Band: Medium; Interpretation Confidence: High Confidence; Internal Conflict Flag: No. Signal Stability Assessment: Deteriorating; Threshold Proximity: Moderate; Revision Sensitivity: High.
Methodology Applied:
- A composite score between -0.75 and 0.75 defines a Neutral housing cycle (1).
- A 3-month change in the composite of less than -0.60 indicates rapid deterioration and high turning-point risk (1).
- Building Permits (PERMIT) serve as the primary lead indicator, while Housing Starts (HOUST) provide pipeline confirmation (1).
- Housing Lead Signal: Latest observation May 31, 2026; Mortgage Rates: June 30, 2026 (1).
Key Dynamics:
- The primary driver is the sharp decline in HOUST (starts), which moved from a positive Z-score of 2.32 in February to -1.28 in May (1).
- The composite score fell from 1.29 (February) to -0.21 (May), a total decline of 1.50, breaching the -0.60 deterioration threshold (1).
- Conditional Invalidation: The current neutral-to-bearish bias would be invalidated if the composite score rises back above 0.75 (1).
- The signal exhibits persistent weakening over the last four months, moving from the top of the range toward the contraction threshold (1).
Scenario Balance:
- Base Case dominant: Continued Neutral regime as permits stabilize, but with a lingering downside bias due to the recent momentum collapse (1).
- Upside Risk: A rapid decline in MORTGAGE30US rates (currently 6.52) could re-stimulate permit growth and restore "Expanding" status (1).
- Downside Risk: The composite score drops below -0.75, triggering a formal "Contracting" regime shift and signaling a broader growth slowdown (1).
Time Horizon & Aggregation:
- Time Horizon: Cyclical (months), reflecting the lead time of residential construction authorizations (1).
- Aggregation Weight Hint: Medium; while the regime is Neutral, the velocity of the recent decline suggests high sensitivity for growth-oriented aggregates (1).
Macro Relevance:
- This signal informs the demand impulse dimension of macro growth, specifically within residential fixed investment (1).
- The transmission mechanism is affordability-driven demand; falling composite scores imply tightening financing constraints and cooling groundbreakings (1).
- Cycle position: Not determined; however, the transition from Expanding to Neutral suggests a late-expansion cooling phase (1).
Regime Context:
- The signal recently exited an "Expanding" regime (last seen February 2026) and has been Neutral for four consecutive months (1).
- Direction of change is weakening, as the composite score approaches the lower contraction boundary (1).
Model Limitations:
- Subject to frequent data revisions and seasonal adjustment errors at cycle turning points (1).
- Weather-related noise can significantly distort monthly HOUST (Starts) data (1).
Data & References:
Housing Lead Chart
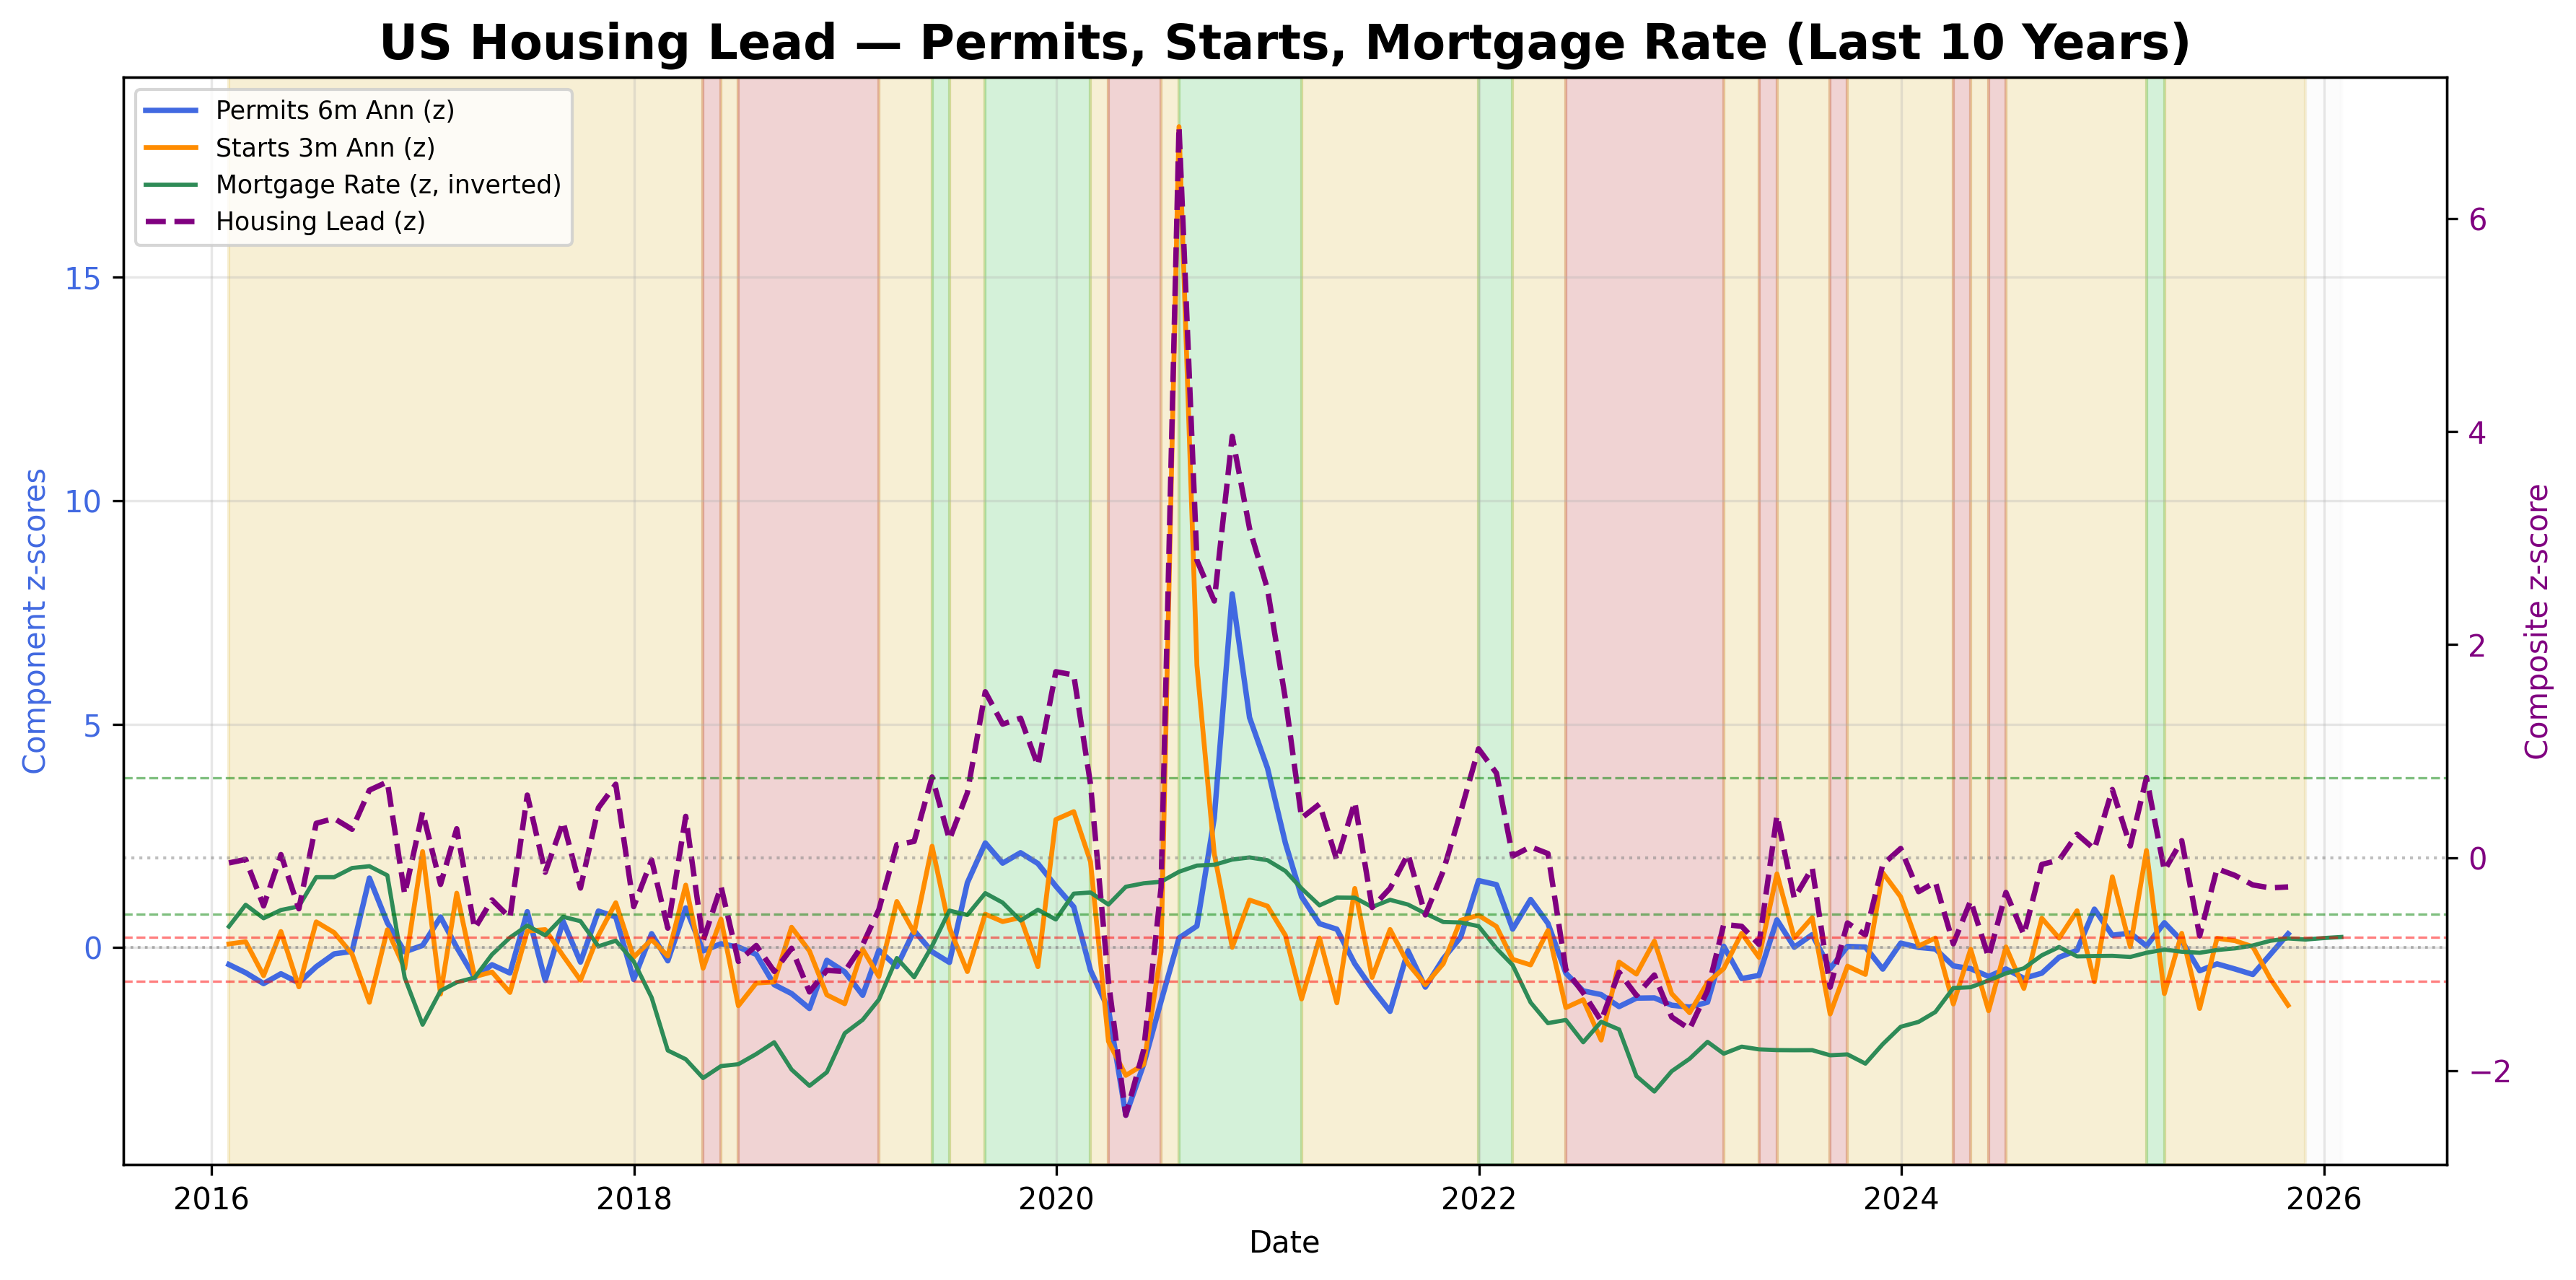
Permits, starts momentum, and mortgage-rate headwinds combined into a housing lead index.
Housing Lead Table▸
The information on this website is provided for general informational and educational purposes only and does not constitute financial, investment, legal, or tax advice. It does not take into account any individual objectives, financial situation, or needs.
All views expressed are personal, based on publicly available information, and do not represent the views of any employer or reflect any proprietary or internal analysis. This information should not be relied upon for making investment decisions.
No representation or warranty is made as to the accuracy, completeness, or timeliness of the information, and no liability is accepted for any loss arising directly or indirectly from its use.
All views expressed are personal, based on publicly available information, and do not represent the views of any employer or reflect any proprietary or internal analysis. This information should not be relied upon for making investment decisions.
No representation or warranty is made as to the accuracy, completeness, or timeliness of the information, and no liability is accepted for any loss arising directly or indirectly from its use.