Hedger Pressure Indicator
CoT hedger pressure: supply expansion & shortage stress.
Gemini Summary
Signal Summary:
- Configuration statement (mandatory): Given a Hedger Shortage Pressure Z-score of 0.61, a Supply Pressure Z-score of 0.26, and a deep long share of 24.7% (1), this setup aligns with Range-biased price paths and Compressed volatility, where the dominant risk is Mean reversion, not Trend continuation.
- The signal has transitioned from a period of high physical stress into a Normal regime as commercial positioning stabilizes within historical norms (1).
- Conviction Band: Medium; Interpretation Confidence: High Confidence; Internal Conflict Flag: No. Signal Stability Assessment: Improving; Threshold Proximity: Far; Revision Sensitivity: Unknown.
Methodology Applied:
- Robust Z-scores between -1.0 and 1.0 for shortage or supply shares denote commercial positioning within historical norms (Neutral) (1).
- Z-scores between 1.0 and 2.0 on the Long Share indicate moderate physical shortage or inventory stress (1).
- The methodology uses commercial net positioning and open interest share to validate speculative sentiment (1).
- Latest observation: 2026-06-09 (1).
Key Dynamics:
- The primary driver is the mean reversion of the Hedger Shortage Pressure Z-score, which fell from a peak of 1.16 in late May to 0.61 (1).
- Momentum indicates a stabilization of physical market stress, with the long share declining from 27.1% to 24.7% over two weeks (1).
- No internal offsets are present; both supply and shortage metrics are trending toward the zero-bound.
- Conditional Invalidation: Shortage Z-score crossing above the 2.0 "Extreme" threshold (1).
- Signal stability is improving as the market exits a multi-month period of physical stress.
Scenario Balance:
- Base Case dominant: Continued normalization of hedger positioning as inventory constraints ease.
- Upside risk: A sudden spike in long pressure (Z > 1.0) triggered by renewed physical supply bottlenecks.
- Downside risk: Rapid supply expansion leading to a surge in hedger short-selling (Z > 1.0).
Time Horizon & Aggregation:
- Time Horizon: Cyclical (months). Futures positioning typically leads price trends over a medium-term lag structure (1).
- Aggregation Weight Hint: Medium. The signal provides a fundamental commercial overlay to speculative data.
Macro Relevance:
- Informs the pricing dimension by tracking commercial supply and demand imbalances (1).
- Economic mechanism: The signal implies a reduction in inventory stress, which typically acts as a disinflationary impulse in the physical market (1).
- Cycle position: Not determined.
- Interacts with speculative crowding; high divergence often precedes trend reversals (1).
Regime Context:
- Transitioning from a persistent "High Shortage" regime (duration: 8 weeks) into a Normal regime (1).
- Direction of change: Weakening stress/stabilising.
Model Limitations:
- Cross-sector behavior variation and static threshold sensitivity (1).
- Sparse open interest data in certain niche markets (1).
Data & References:
Hedger Pressure Chart
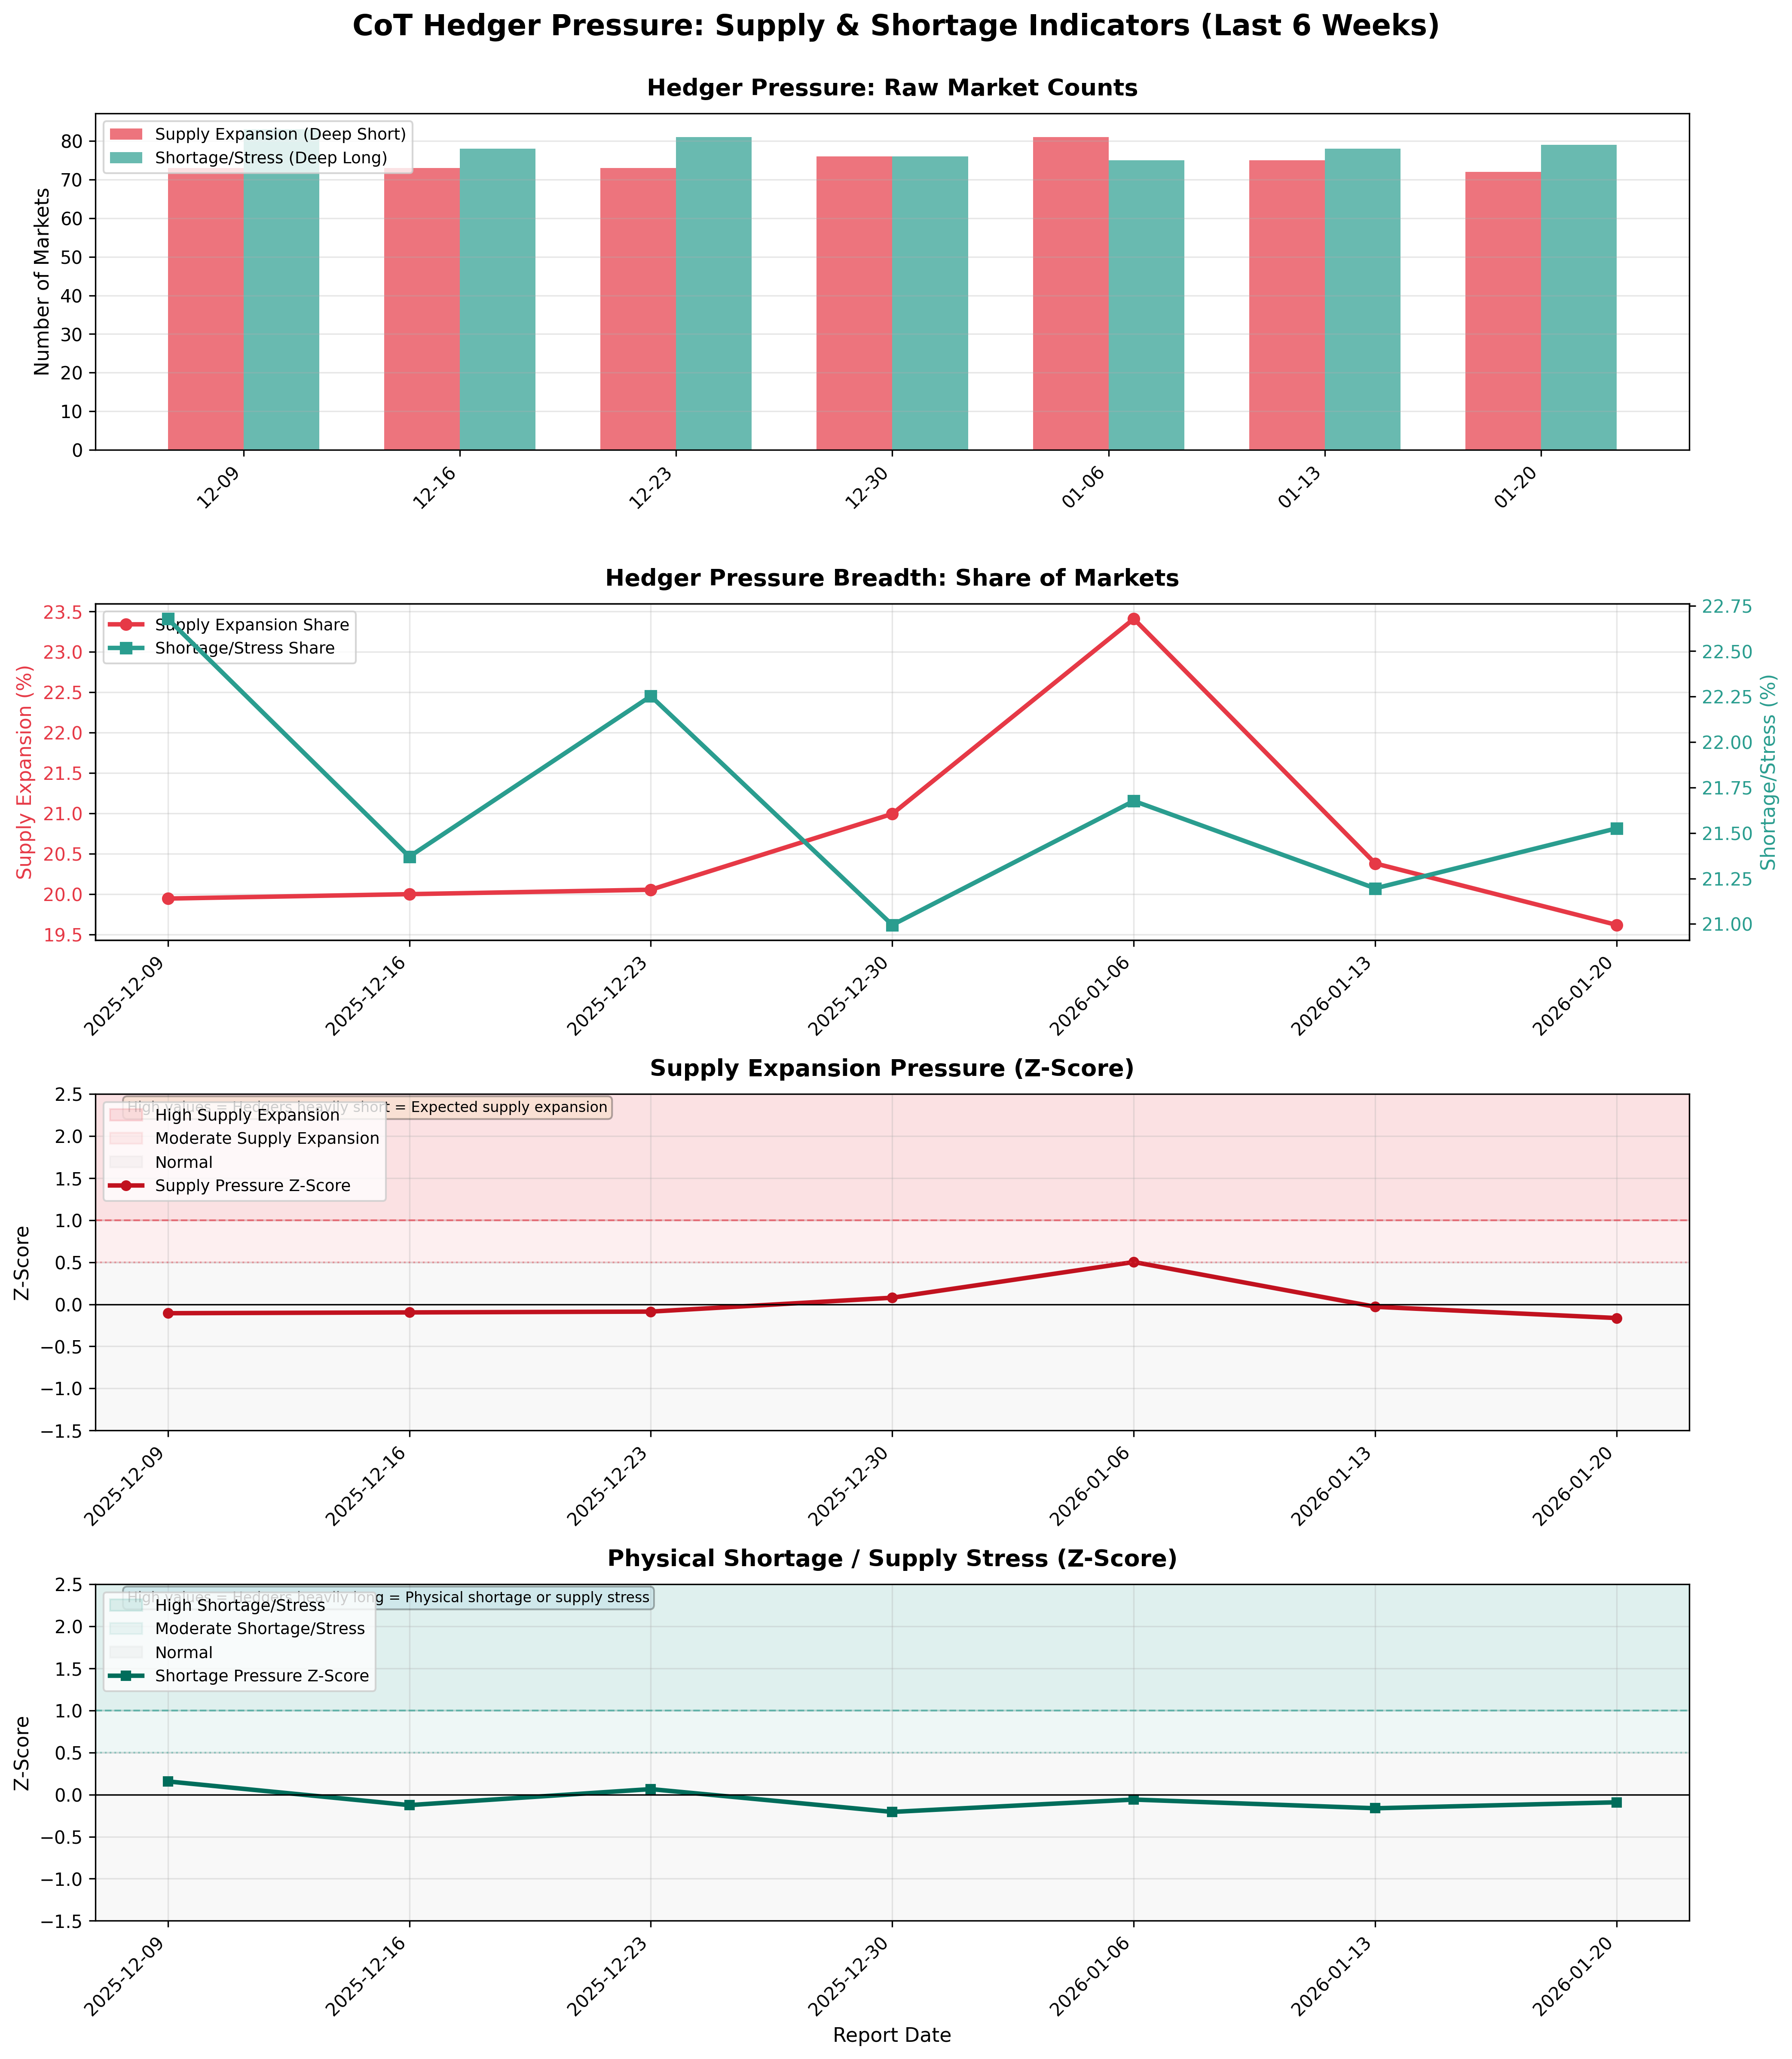
Supply expansion and shortage stress by hedger positioning.
Hedger Pressure Table▸
The information on this website is provided for general informational and educational purposes only and does not constitute financial, investment, legal, or tax advice. It does not take into account any individual objectives, financial situation, or needs.
All views expressed are personal, based on publicly available information, and do not represent the views of any employer or reflect any proprietary or internal analysis. This information should not be relied upon for making investment decisions.
No representation or warranty is made as to the accuracy, completeness, or timeliness of the information, and no liability is accepted for any loss arising directly or indirectly from its use.
All views expressed are personal, based on publicly available information, and do not represent the views of any employer or reflect any proprietary or internal analysis. This information should not be relied upon for making investment decisions.
No representation or warranty is made as to the accuracy, completeness, or timeliness of the information, and no liability is accepted for any loss arising directly or indirectly from its use.