Global Risk-On / Risk-Off Positioning Tone
CoT market tone: risk-on vs risk-off positioning.
Gemini Summary
Signal Summary:
- Configuration statement: Given the robust z-score of 1.36 and a crowded long share of 27.1%, this setup aligns with Upward-biased price paths and Normal volatility, where the dominant risk is Trend continuation, not Mean reversion (1).
- The signal is currently in a Strong Risk-On regime, reflecting extreme speculative long alignment across global futures markets (1).
- Conviction Band: High; Interpretation Confidence: High Confidence; Internal Conflict Flag: No. Signal Stability Assessment: Stable; Threshold Proximity: Moderate; Revision Sensitivity: Unknown.
Methodology Applied:
- Regimes are defined by robust z-scores of net positioning breadth; scores above 1.0 signify Strong Risk-On (1).
- The investment implication for this regime is to maintain an aggressive risk exposure and pro-cyclical bias (1).
- Positioning is assessed via the net breadth of crowded longs versus crowded shorts (1).
- Global Risk-On / Risk-Off Positioning Tone: Latest observation 2026-03-17 (1).
Key Dynamics:
- The primary driver is a robust z-score of 1.36, indicating a significant speculative appetite for risk (1).
- Crowded long count (98) significantly outweighs crowded shorts (77), maintaining a positive net tone (1).
- Momentum has stabilized after peaking in early February, with the z-score retreating from 1.94 but remaining well within extreme territory (1).
- Conditional Invalidation: A decline in the robust z-score below the 1.0 threshold into "Risk-On" or "Neutral" territory.
- Signal stability is high, as the Strong Risk-On regime has persisted for seven consecutive reporting cycles (1).
Scenario Balance:
- Dominant base case: Trend continuation supported by persistent speculative crowding in pro-cyclical assets (1).
- Most plausible upside risk: A renewed surge in speculative breadth toward the 1.9 z-score peak if macro data improves.
- Most plausible downside risk: Trend exhaustion or a sharp squeeze if speculative long alignment becomes overextended (1).
Time Horizon & Aggregation:
- Tactical (weeks): Positioning shifts and crowding are explicitly defined as tactical setup guides (1).
- Aggregation Weight Hint: High, given the persistence of the extreme regime and its role as a primary sentiment filter.
Macro Relevance:
- This signal informs the sentiment and risk appetite dimension of the macro landscape (1).
- The implied economic mechanism is speculative flow momentum and crowding intensity driving asset pricing (1).
- Cycle position: Not determined.
- Interacts with VIX and Credit Spreads to confirm if positioning alignment is supported by broader financial stability (1).
Regime Context:
- This is a persistent regime, maintained since February 2026 (1).
- The direction of change is stabilising at high levels after a moderate weakening from February peaks (1).
Model Limitations:
- May mask sector-level divergence and is sensitive to liquidity levels in thin markets (1).
- Static thresholds might lag structural market shifts (1).
Data & References:
Market Tone Chart
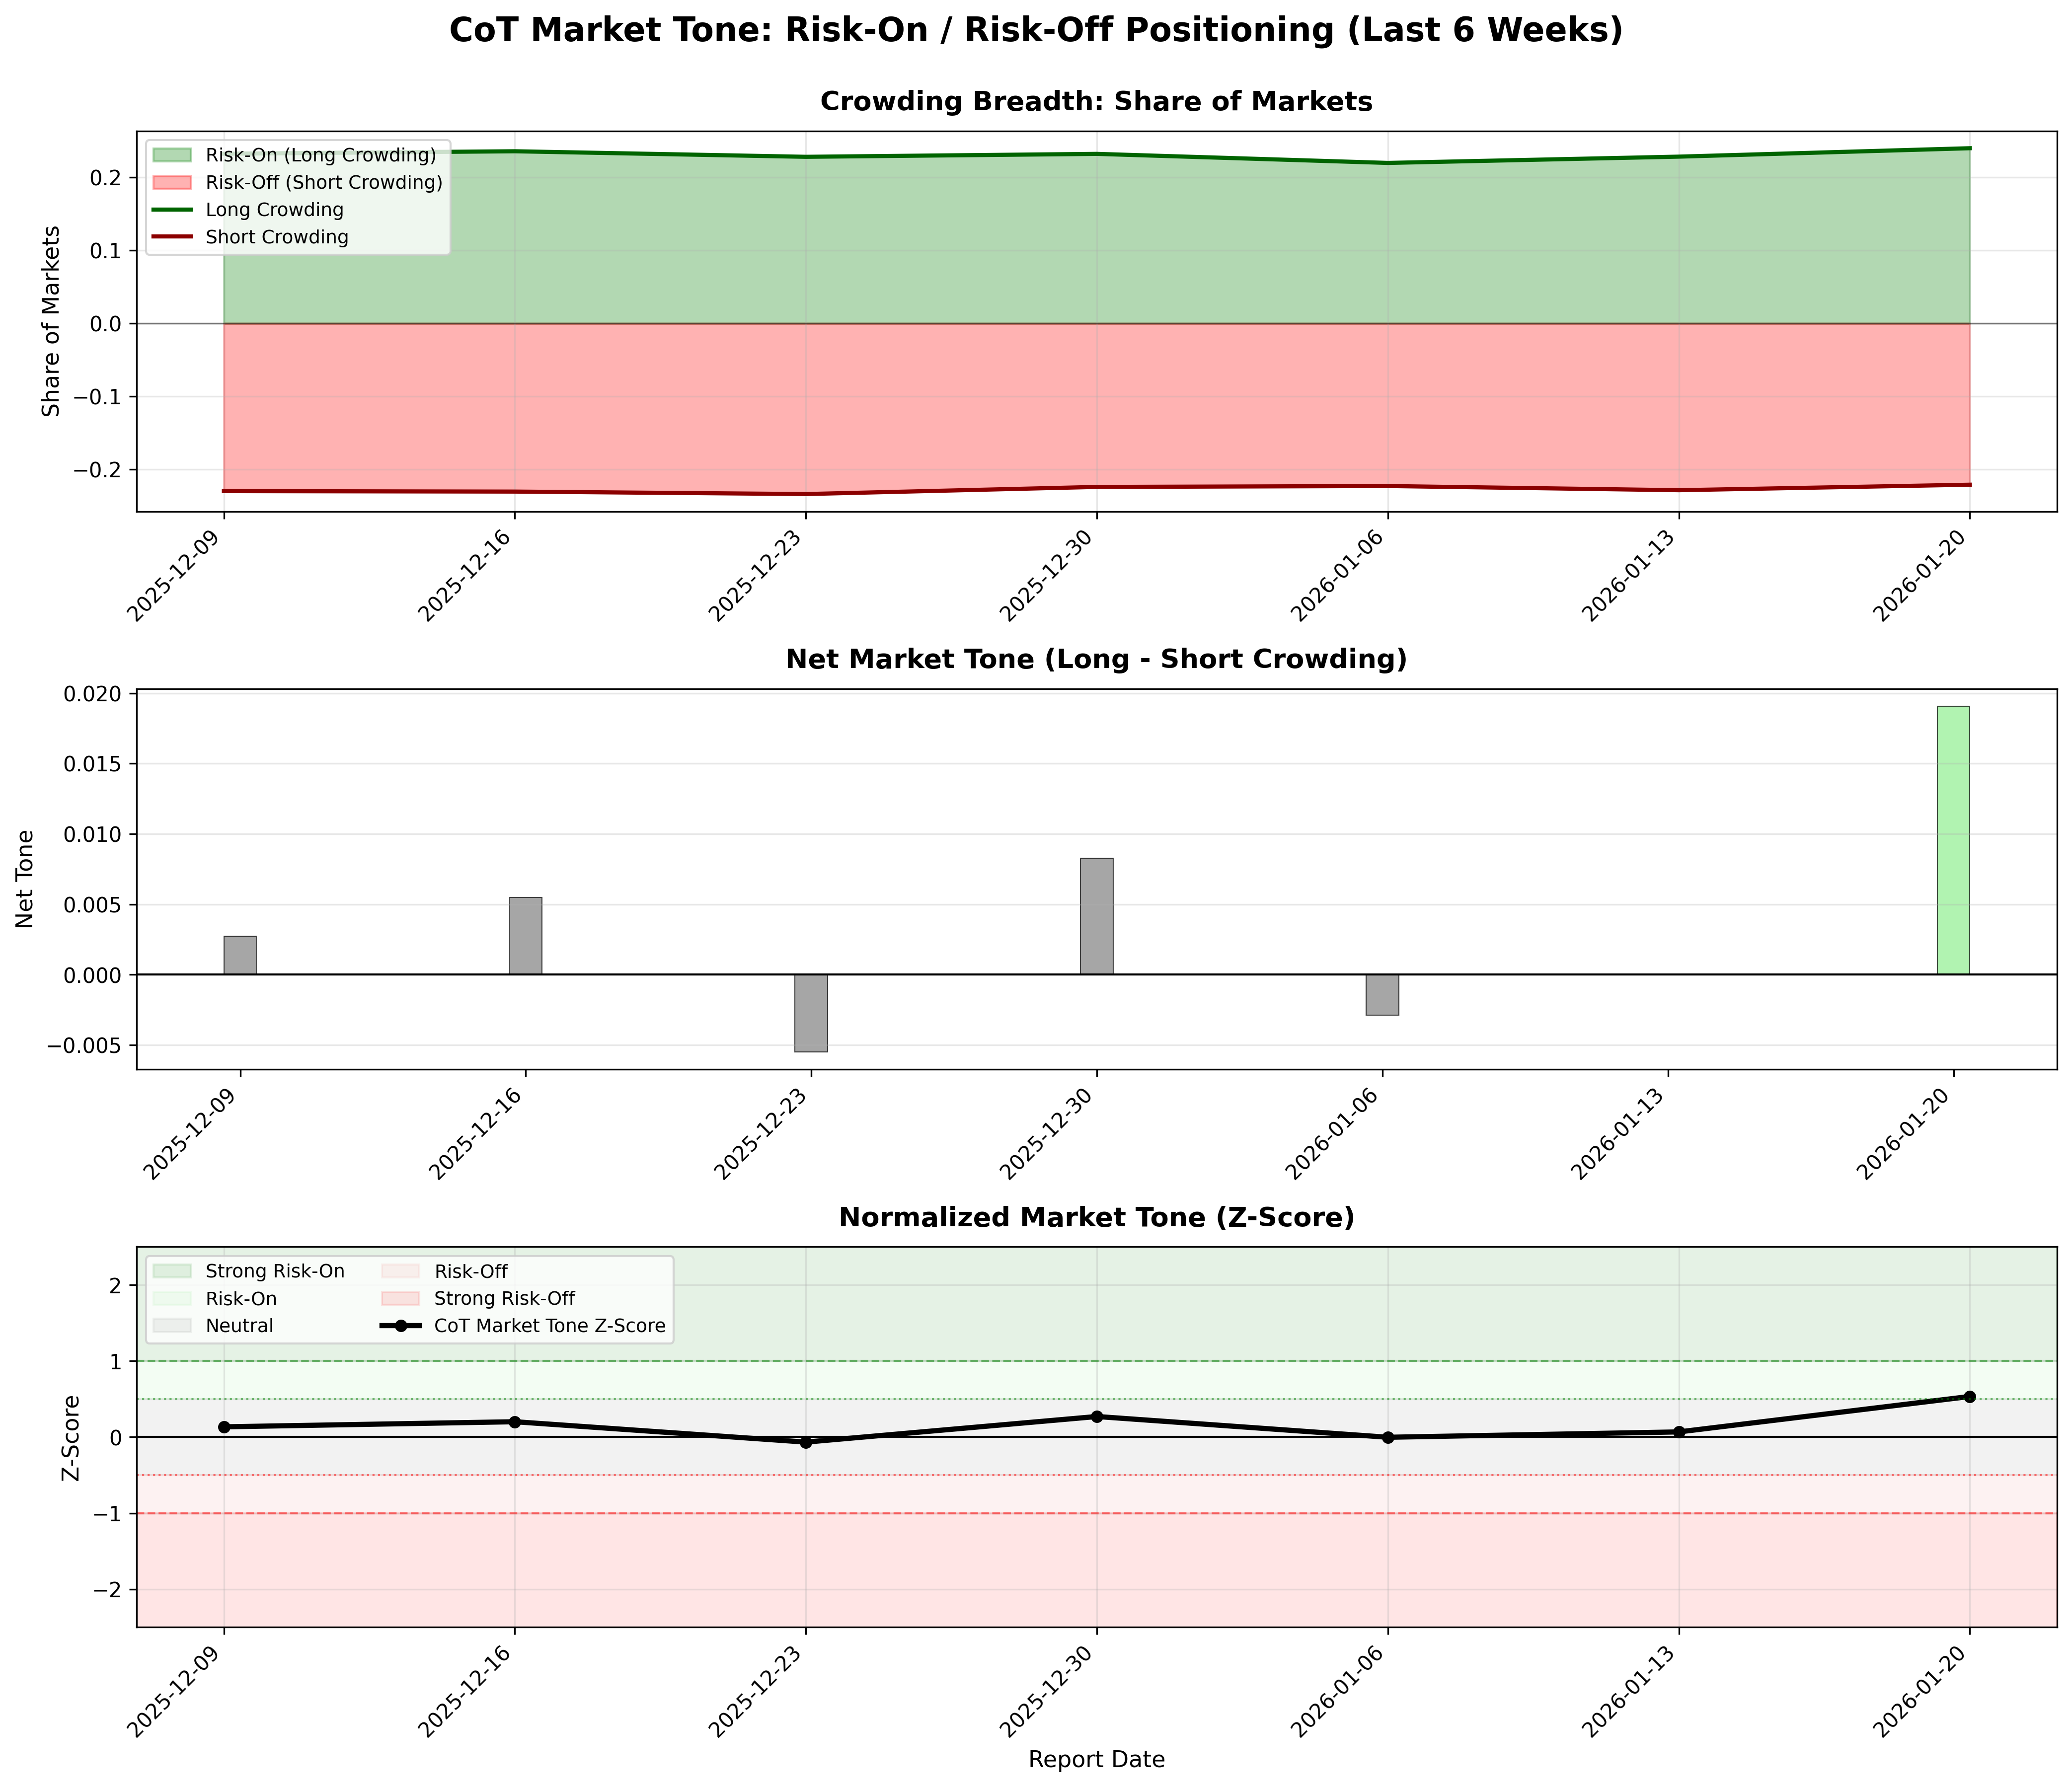
Risk-on / risk-off crowding and tone by market breadth.
Global Positioning Tone Table▸
The information presented is for general informational purposes only and does not constitute financial or investment advice. It has been prepared without regard to individual objectives, financial situation, or needs. You should consider whether it is appropriate for your circumstances and seek independent advice where necessary.