Financial Stress Index Signal
Market-wide financial stress and systemic risk conditions.
Gemini Summary
Signal Summary:
- Configuration statement: Given a STLFSI4 value of -0.8681 and a Stress_z score of -0.8897, this setup aligns with Upward-biased price paths and Compressed volatility, where the dominant risk is Regime shift, not Mean reversion (1).
- The signal is currently in a Bullish regime, indicating below-normal stress levels and loose financial conditions (1).
- Conviction Band: High; Interpretation Confidence: High Confidence; Internal Conflict Flag: No. Signal Stability Assessment: Improving; Threshold Proximity: Moderate; Revision Sensitivity: Unknown.
Methodology Applied:
- Bullish/Risk-on is defined by STLFSI4 < 0 and a z-score < -0.5, implying favorable environments for risk assets (1).
- Falling index values signal a transition toward risk-on and expansionary states (1).
- The methodology uses headline STLFSI4 for regime classification and z-scores for robustness (1).
- Financial Stress Index (STLFSI4) weekly series, latest observation 2026-06-05 (1).
Key Dynamics:
- The primary driver is the Stress_z score (-0.8897), which has crossed the -0.5 threshold for Bullish classification (1).
- Momentum is currently improving as the index moves deeper into negative territory from a previous Neutral state.
- Conditional Invalidation: A Stress_z score rising above -0.5 or STLFSI4 crossing above 0 (1).
- Recent history shows a successful transition from a persistent Bearish state (March 2026) to the current Bullish regime (1).
Scenario Balance:
- Base case dominant: Persistence of Bullish regime supported by continued loose financial conditions.
- Upside risk: Strengthening of Bullish signal as Stress_z approaches historical lows.
- Downside risk: Rapid mean reversion triggered by equity volatility or credit spread spikes.
Time Horizon & Aggregation:
- Time Horizon: Tactical (weeks); the signal utilizes a weekly series reflecting immediate market tightness (1).
- Aggregation Weight Hint: High; systemic financial stress is a fundamental driver of broad macro risk regimes.
Macro Relevance:
- This signal informs the liquidity and pricing dimensions of the macro environment (1).
- The implied economic mechanism is high intermediation capacity and low risk aversion, facilitating capital flow (1).
- Cycle position: Not determined.
Regime Context:
- The current Bullish regime is newly entered as of early June 2026.
- Direction of change is strengthening, moving from Neutral (-0.21 z-score) to Bullish (-0.88 z-score) in one week (1).
Model Limitations:
- Potential for data staleness in components like interbank funding spreads and whipsaw risk near regime thresholds (1).
Data & References:
Financial Stress Index Chart
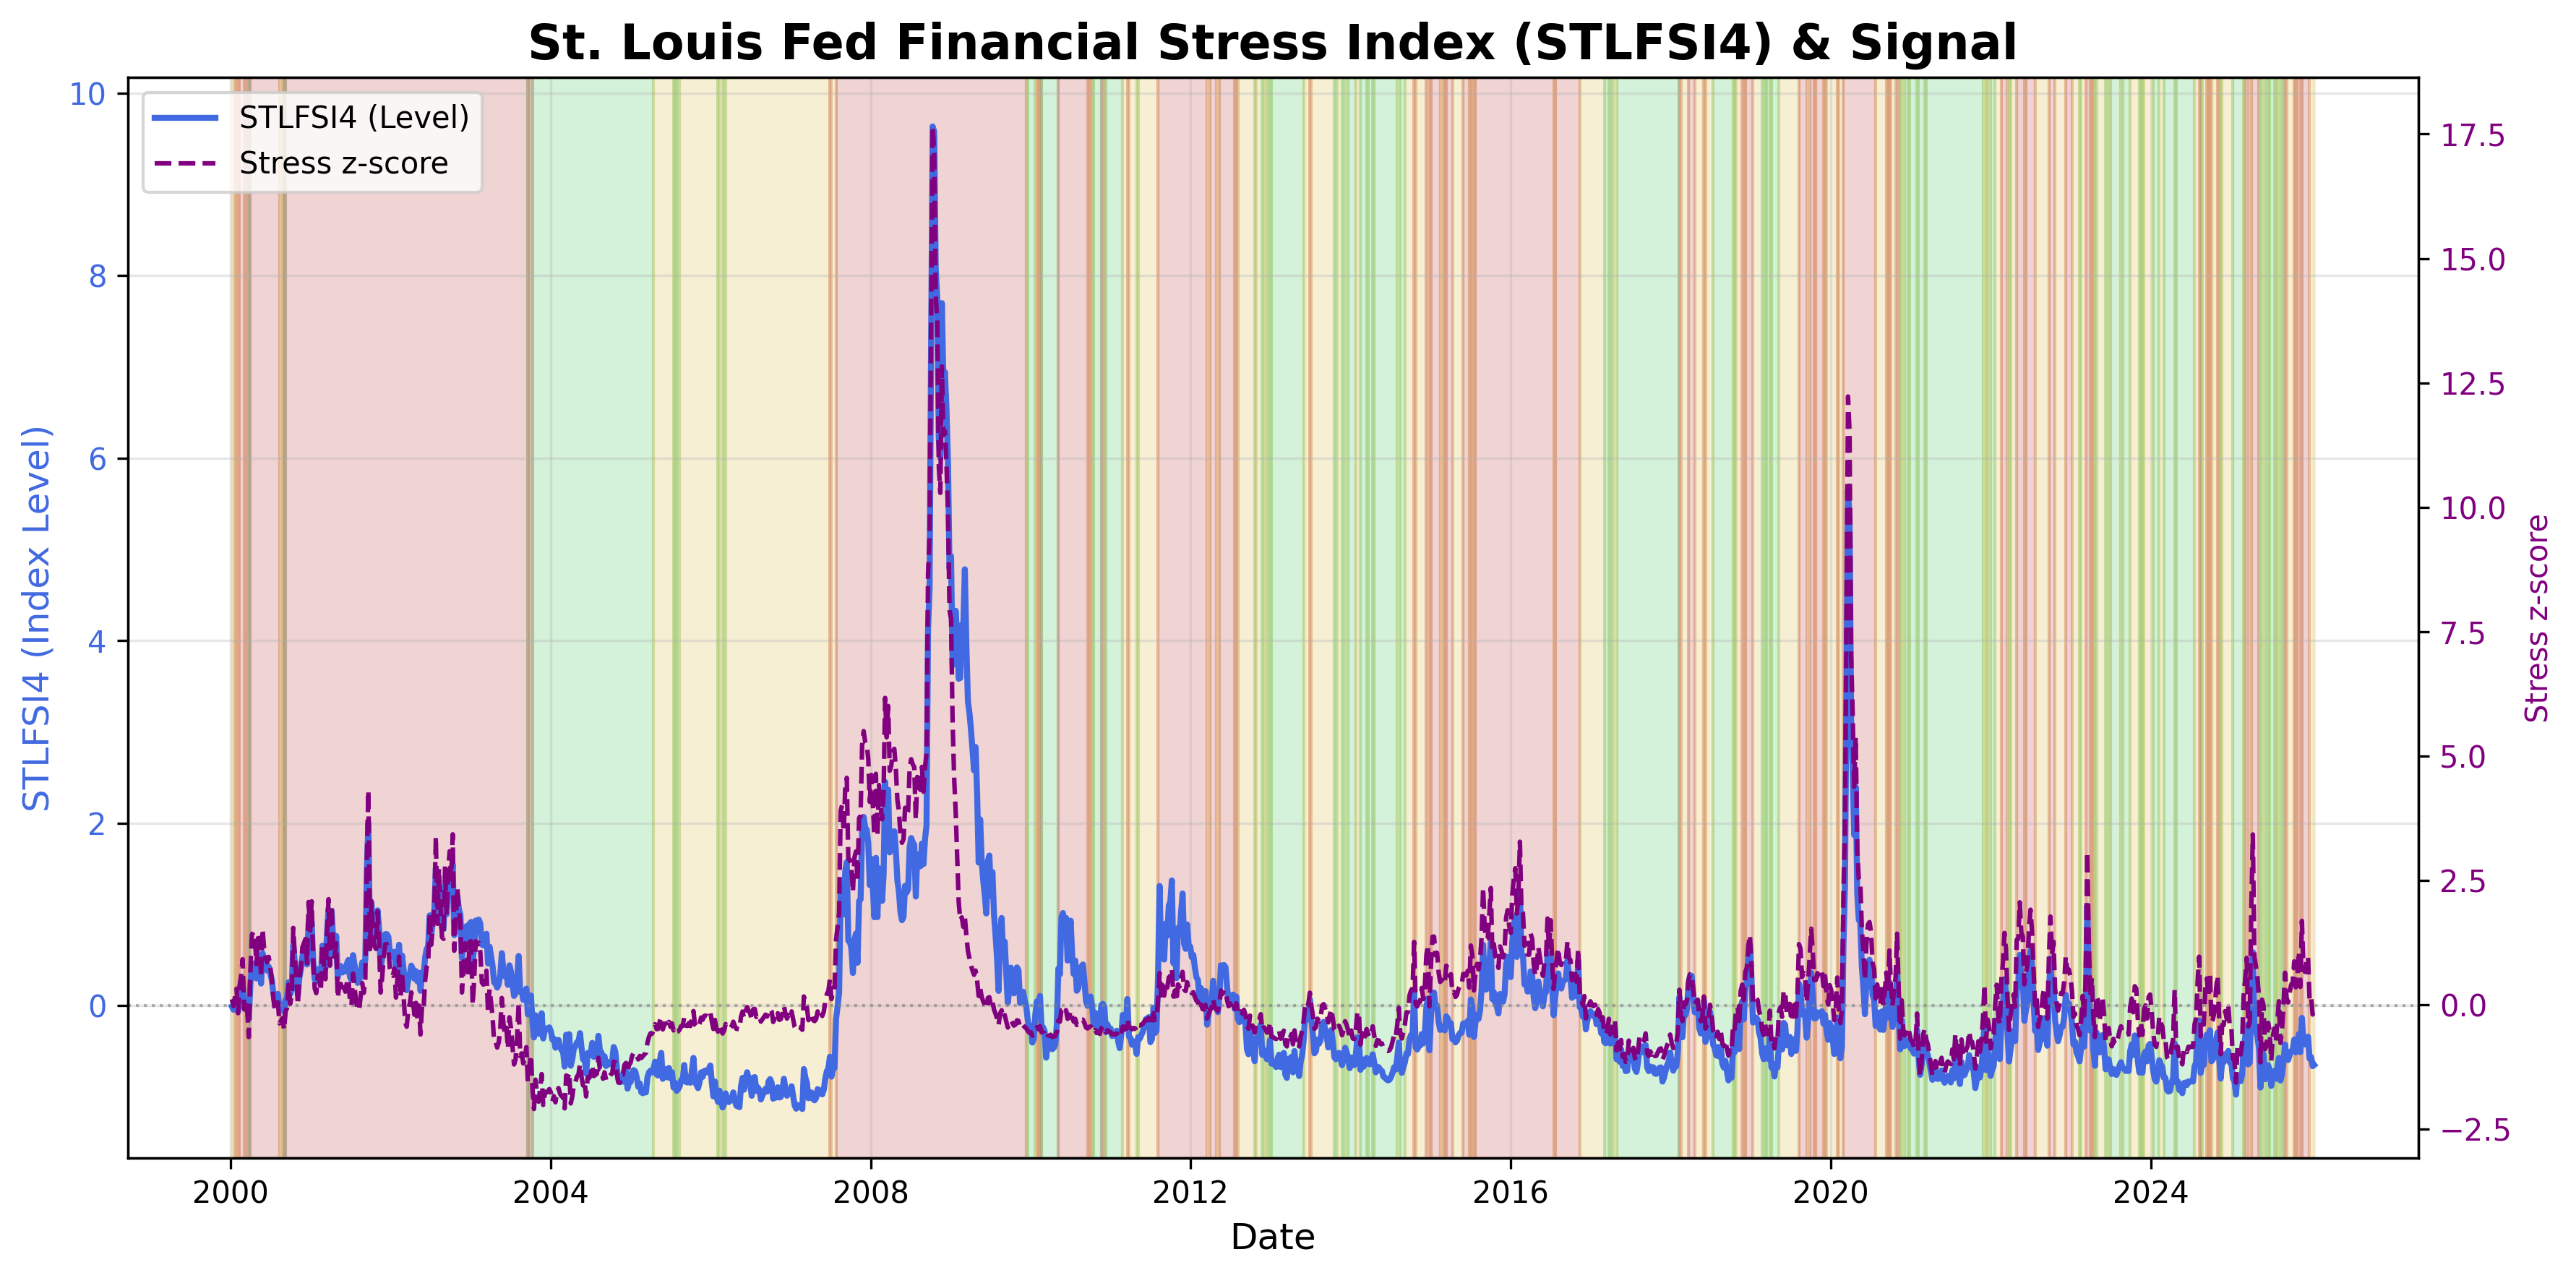
Composite financial stress conditions across markets.
Financial Stress Index Table▸
The information on this website is provided for general informational and educational purposes only and does not constitute financial, investment, legal, or tax advice. It does not take into account any individual objectives, financial situation, or needs.
All views expressed are personal, based on publicly available information, and do not represent the views of any employer or reflect any proprietary or internal analysis. This information should not be relied upon for making investment decisions.
No representation or warranty is made as to the accuracy, completeness, or timeliness of the information, and no liability is accepted for any loss arising directly or indirectly from its use.
All views expressed are personal, based on publicly available information, and do not represent the views of any employer or reflect any proprietary or internal analysis. This information should not be relied upon for making investment decisions.
No representation or warranty is made as to the accuracy, completeness, or timeliness of the information, and no liability is accepted for any loss arising directly or indirectly from its use.