Explicit Slack Gap Signal
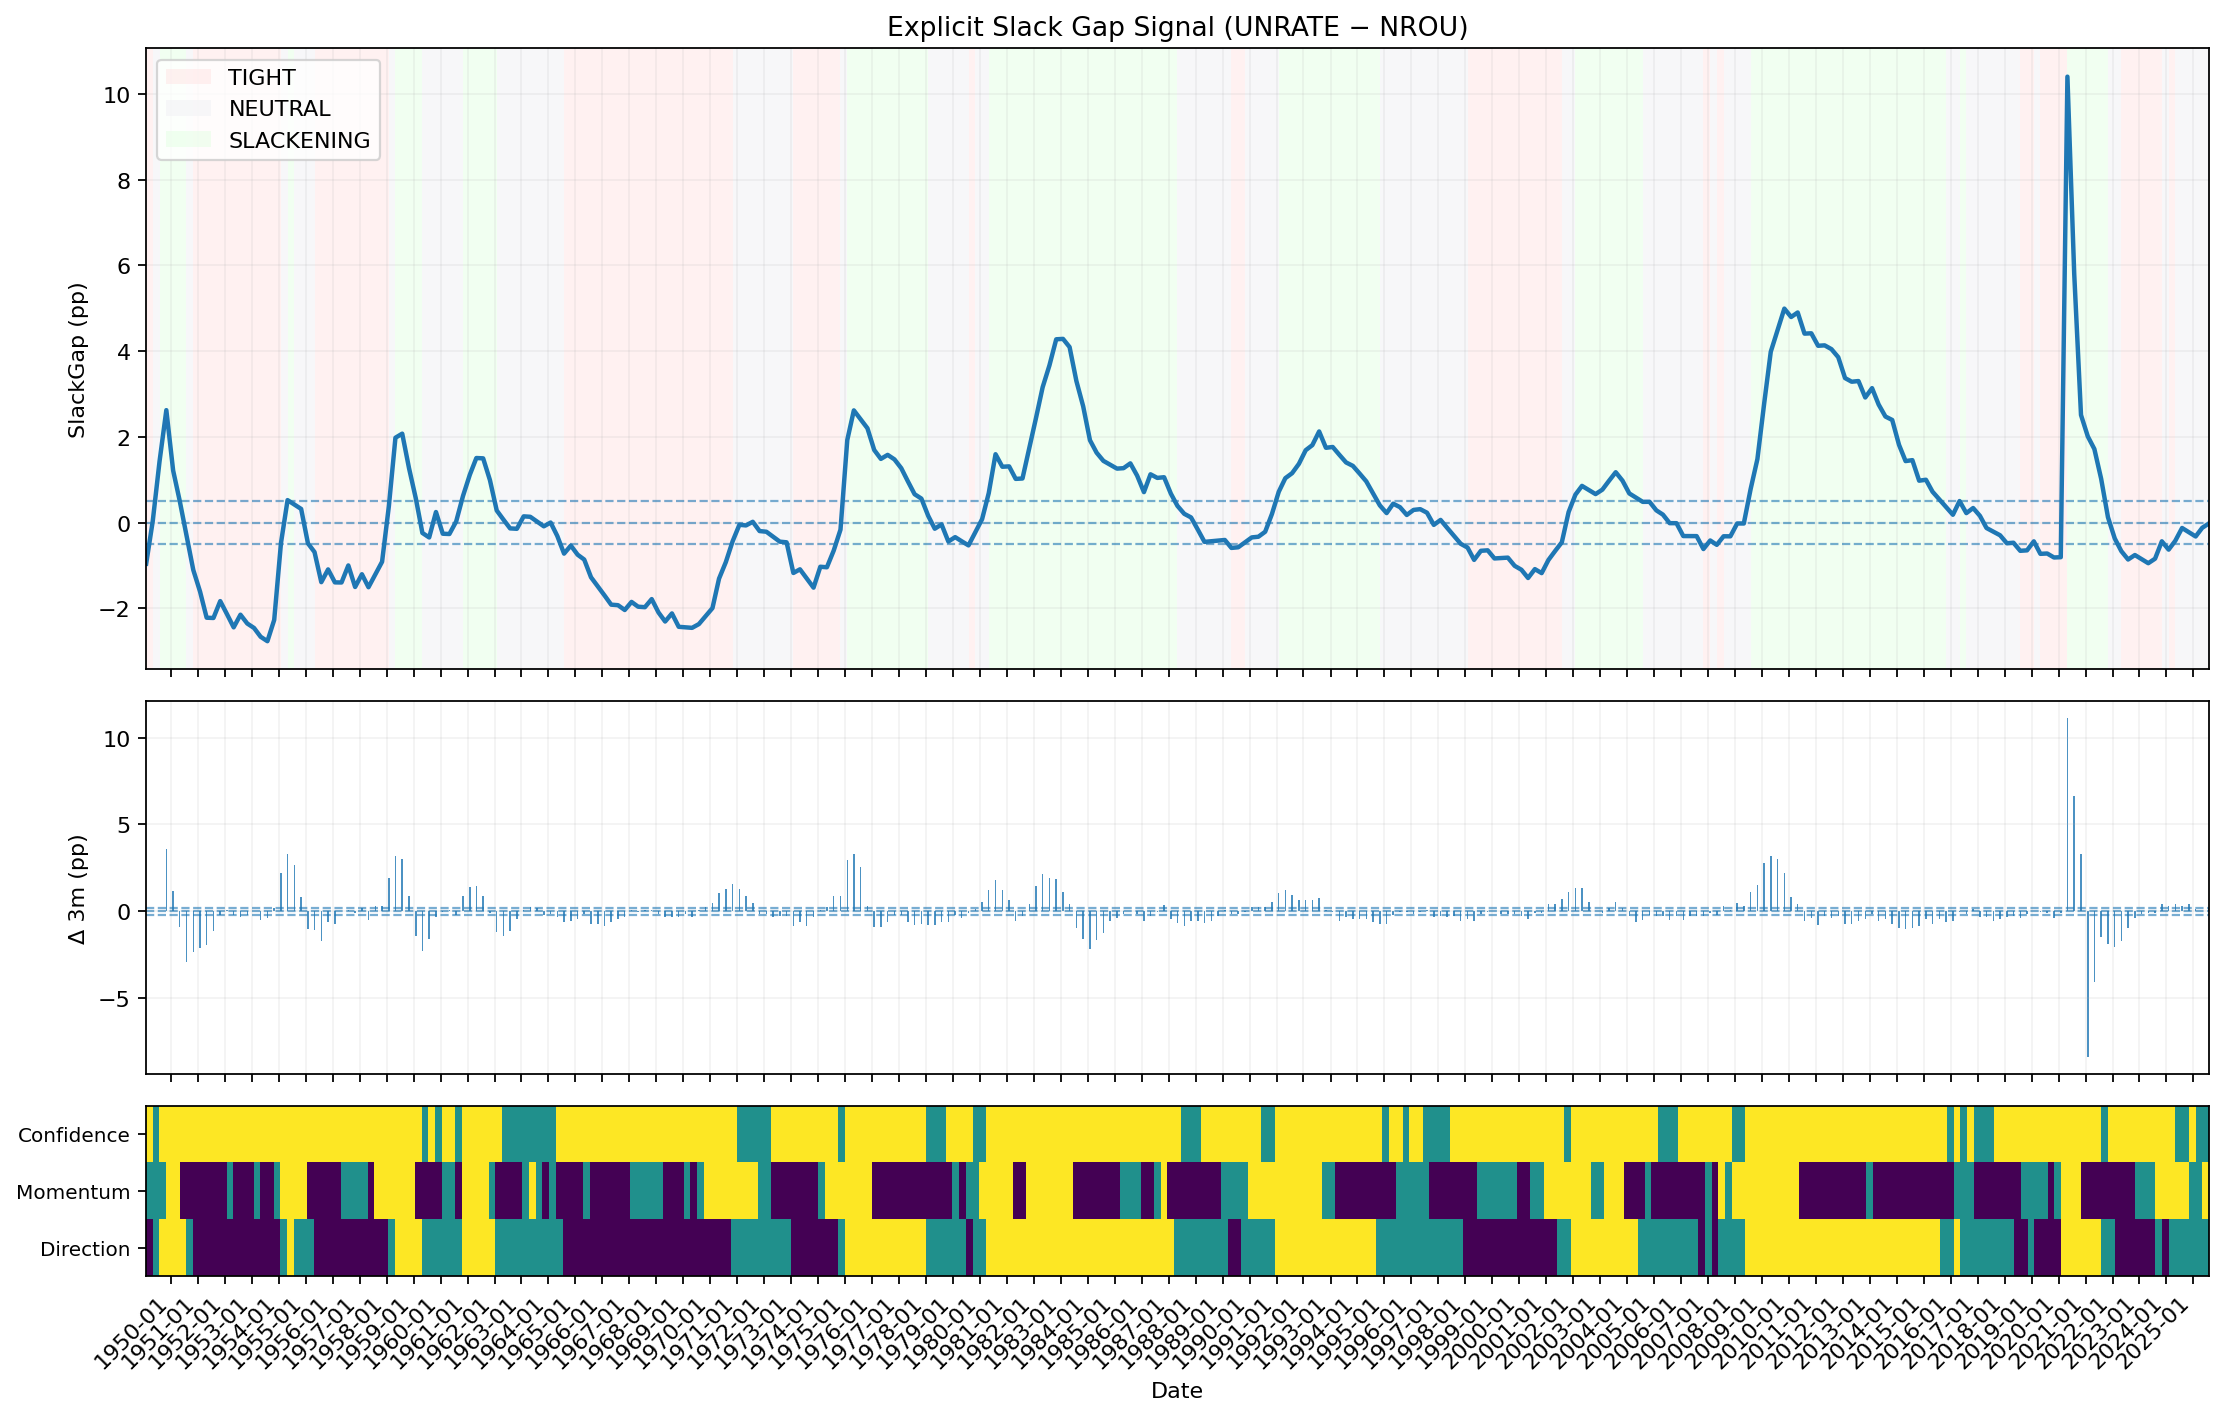
Explicit labour market slack: UNRATE minus NROU.
Gemini Summary
Signal Summary:
- Configuration statement: Given a SlackGap of -0.10 pp and a SlackGap_change_3m of +0.11 pp, this setup aligns with Range-biased price paths and Normal volatility, where the dominant risk is Data uncertainty, not Regime shift, based on the equilibrium rule for gaps under 0.25 pp (1).
- The signal is currently in a NEUTRAL regime, indicating the labor market is positioned near structural equilibrium with minimal cyclical deviation (1).
- Conviction Band: Low; Interpretation Confidence: Low Confidence; Internal Conflict Flag: No. Signal Stability Assessment: Stable; Threshold Proximity: Near; Revision Sensitivity: High.
Methodology Applied:
- Gaps within |0.25| pp of the natural rate (NROU) signify structural equilibrium and high estimation uncertainty (1).
- A SlackGap_change_3m below the 0.20 pp threshold indicates stable cyclical momentum (1).
- Interpretation weights are reduced when the SlackGap is near zero due to the model-based nature of NROU (1).
- Explicit Slack Gap Signal: Latest observation 2026-04-30 (1).
Key Dynamics:
- The primary driver is the narrow -0.10 pp SlackGap, which sits well above the -0.50 pp threshold required for a Tight regime classification (1).
- Momentum has stabilised, with the 3-month change (+0.11 pp) remaining below the +0.20 pp trigger for cyclical deterioration (1).
- Conditional Invalidation: A move in the SlackGap beyond the +/- 0.50 pp threshold would force a regime shift (1).
- History shows persistent neutrality since mid-2024, following a transition from a previously tight labor market (1).
Scenario Balance:
- Base case dominant: Continued equilibrium as long as SlackGap remains within +/- 0.25 pp (1).
- Upside risk: Unexpected tightening triggered if the SlackGap narrows below -0.50 pp (1).
- Downside risk: Disinflationary slowdown if the 3-month change accelerates beyond +0.20 pp (1).
Time Horizon & Aggregation:
- Time Horizon: Cyclical (months), reflecting the measurement of cyclical deviations from structural norms (1).
- Aggregation Weight Hint: Low, due to the high uncertainty and neutral policy bias associated with equilibrium states (1).
Macro Relevance:
- Informs the labor market dimension of the macro cycle, specifically identifying the absence of excess slack or tightness (1).
- Economic mechanism: Labor market equilibrium implies a neutral central bank reaction function and stable structural pricing power (1).
- Cycle position: Not determined.
Regime Context:
- The signal reflects a persistent NEUTRAL regime that has been in place for several quarters (1).
- Direction of change: Stabilising at equilibrium levels (1).
Model Limitations:
- NROU is a model-based estimate subject to retrospective revisions (1).
- Unemployment is a lagging indicator, particularly near cycle turning points (1).
Data & References:
Explicit Slack Gap Signal Chart
Explicit labour market slack: UNRATE minus NROU.
Explicit Slack Gap Signal Table▸
The information on this website is provided for general informational and educational purposes only and does not constitute financial, investment, legal, or tax advice. It does not take into account any individual objectives, financial situation, or needs.
All views expressed are personal, based on publicly available information, and do not represent the views of any employer or reflect any proprietary or internal analysis. This information should not be relied upon for making investment decisions.
No representation or warranty is made as to the accuracy, completeness, or timeliness of the information, and no liability is accepted for any loss arising directly or indirectly from its use.
All views expressed are personal, based on publicly available information, and do not represent the views of any employer or reflect any proprietary or internal analysis. This information should not be relied upon for making investment decisions.
No representation or warranty is made as to the accuracy, completeness, or timeliness of the information, and no liability is accepted for any loss arising directly or indirectly from its use.