Energy-Adjusted Metals Tailwind Signal
Energy- and FX-adjusted copper residual as a metals demand tailwind indicator.
Gemini Summary
Signal Summary:
- Configuration statement: Given a Metals_Tailwind z-score of 2.037 and a positive Copper_Residual of 1.782, this setup aligns with Upward-biased price paths and Normal volatility, where the dominant risk is Trend continuation, not Mean reversion (1).
- The signal is currently in a "Demand_Tailwind" regime, indicating copper is significantly rich relative to energy and currency inputs (1).
- Conviction Band: Extreme; Interpretation Confidence: High Confidence; Internal Conflict Flag: No. Signal Stability Assessment: Stable; Threshold Proximity: Far; Revision Sensitivity: Unknown.
Methodology Applied:
- Robust z-scores exceeding +0.75 define the Demand_Tailwind regime, signaling strong industrial demand or supply scarcity (1).
- The Metals_Tailwind metric measures idiosyncratic copper strength by regressing prices against Oil (WTI) and the US Dollar (DTWEXBGS) (1).
- Rising values imply expansionary demand or supply-side tightness, supporting a "risk-on" investment implication (1).
- Energy-Adjusted Metals Tailwind Signal, observed 2026-06-30.
Key Dynamics:
- The primary driver is the large positive Copper_Residual (1.782), showing copper's price (6.33) decoupled from energy costs (95.00) (1).
- Momentum has stabilized at high levels; the z-score has remained above 1.0 for three consecutive months (1).
- Internal coherence is high as both the residual and z-score are at multi-year extremes.
- Conditional Invalidation: Metals_Tailwind z-score falling below the +0.75 threshold (1).
- The regime shows strong persistence, having remained in a tailwind state for 8 of the last 14 months (1).
Scenario Balance:
- Dominant base case: Continued copper outperformance driven by idiosyncratic industrial demand or supply constraints.
- Most plausible upside risk: Further supply-side tightness causing the z-score to breach 3.0.
- Most plausible downside risk: A sharp decline in global industrial production leading to rapid mean reversion of the residual.
Time Horizon & Aggregation:
- Time Horizon: Cyclical (months) based on the monthly frequency and lead indicator properties for global growth (1).
- Aggregation Weight Hint: High, due to the extreme z-score and high data freshness.
Macro Relevance:
- Informs the "demand and pricing" macro dimension, specifically regarding industrial commodities.
- Economic mechanism: Idiosyncratic demand impulse suggesting expansionary global industrial activity (1).
- Cycle position: Not determined.
- Interacts with PMIs and industrial production; high z-scores typically precede or confirm broad manufacturing strength.
Regime Context:
- Persistent regime; the signal has maintained a "Demand_Tailwind" since April 2026 (1).
- Direction of change: Stabilising at extreme positive levels.
Model Limitations:
- Oil shocks are heterogeneous and may distort residuals; levels-based OLS may face stationarity issues (1).
Data & References:
Energy-Adjusted Metals Tailwind Chart
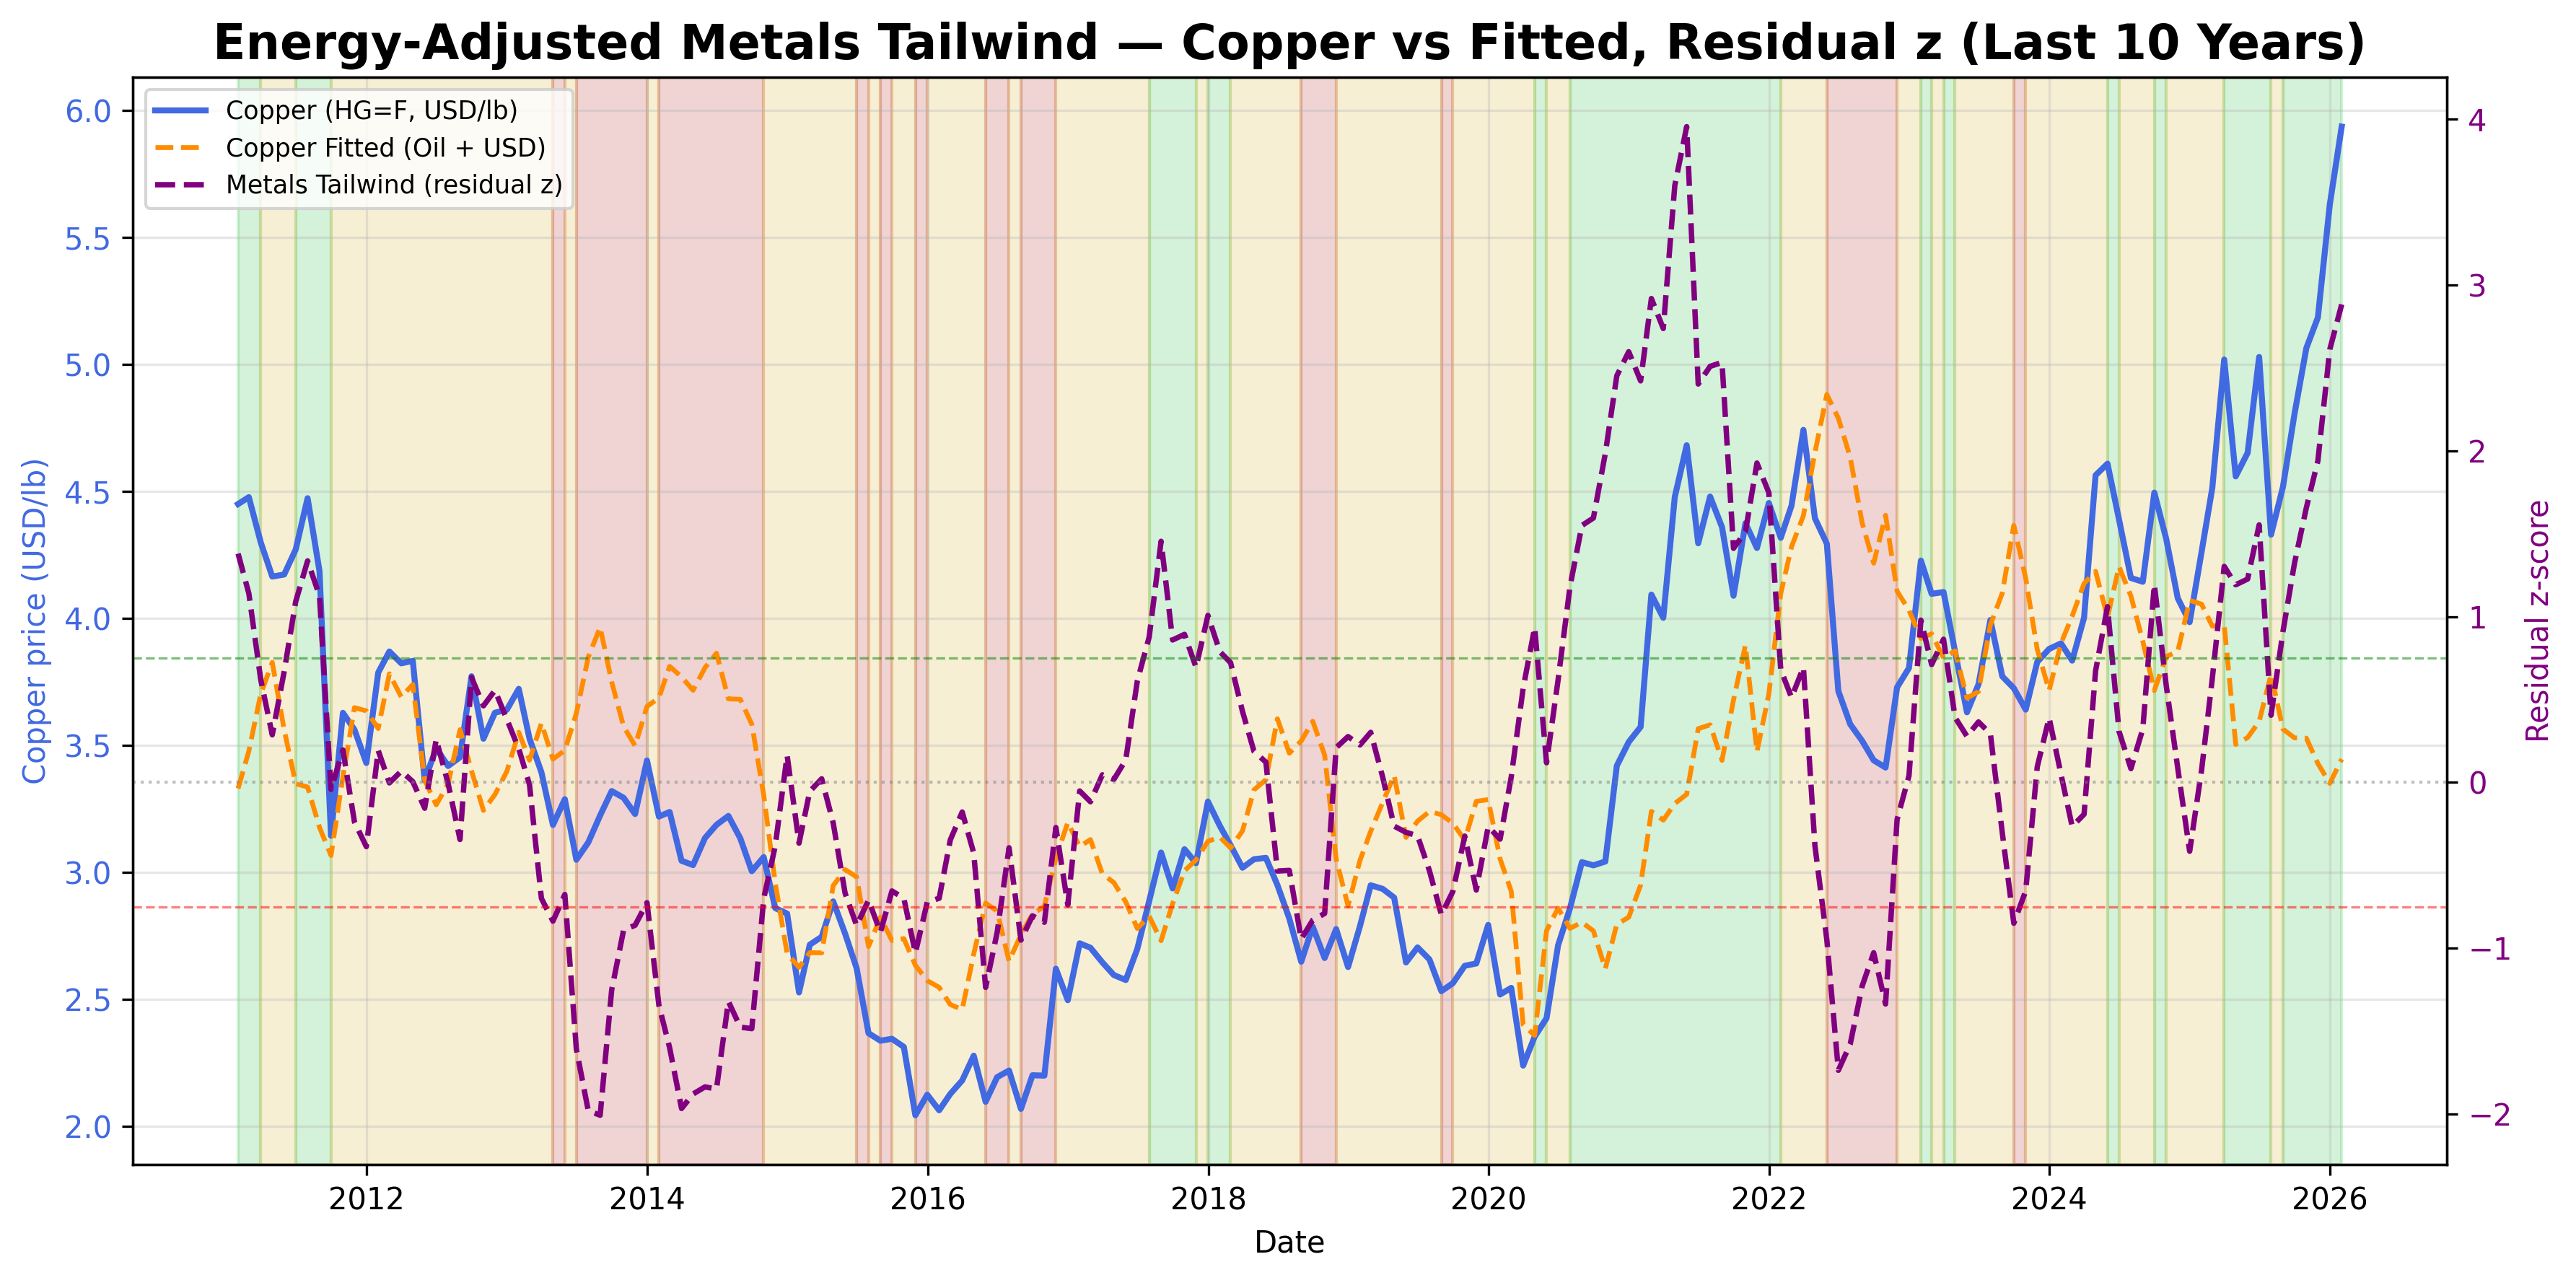
Copper residual after controlling for WTI and the broad USD, scaled as a metals tailwind index.
Energy-Adjusted Metals Tailwind Table▸
The information on this website is provided for general informational and educational purposes only and does not constitute financial, investment, legal, or tax advice. It does not take into account any individual objectives, financial situation, or needs.
All views expressed are personal, based on publicly available information, and do not represent the views of any employer or reflect any proprietary or internal analysis. This information should not be relied upon for making investment decisions.
No representation or warranty is made as to the accuracy, completeness, or timeliness of the information, and no liability is accepted for any loss arising directly or indirectly from its use.
All views expressed are personal, based on publicly available information, and do not represent the views of any employer or reflect any proprietary or internal analysis. This information should not be relied upon for making investment decisions.
No representation or warranty is made as to the accuracy, completeness, or timeliness of the information, and no liability is accepted for any loss arising directly or indirectly from its use.