Forward Indicators of Economic Cycles (Momentum of Flows)
CoT sector flow & momentum: economic cycle proxies.
Gemini Summary
Signal Summary:
-
Configuration statement (mandatory):
Given the deeply negative
avg_flow_4w(-2.71) and extremely lowtrend_confirm_share(0.08), this setup aligns with Downward-biased price paths and Elevated volatility, where the dominant risk is Regime shift, not trend continuation. - The signal has transitioned into a volatile state following a significant negative flow shock, currently reflecting a risk-off or transition regime (1).
- Conviction Band: Low; Interpretation Confidence: Mixed Signals; Internal Conflict Flag: Yes. Signal Stability Assessment: Volatile; Threshold Proximity: Near; Revision Sensitivity: Unknown.
Methodology Applied:
- A negative
avg_flow_4w_momindicates flow velocity is deteriorating, warning of a potential topping pattern or slowdown (1). - Rising
contrarian_flow_share(currently 0.17) signifies flows moving against crowded positions, indicating high reversal risk (1). - The methodology interprets negative momentum and high
neg_flow_share(0.67) as indicators of a transition or risk-off regime (1). - Forward Indicators of Economic Cycles (Momentum of Flows): latest observation 2026-06-09.
Key Dynamics:
- The primary driver is the collapse in
trend_confirm_shareto 0.08, suggesting speculative support for the previous trend has evaporated (1). - Momentum shows an inflection (
avg_flow_4w_momof 2.27), though this is a technical bounce from a prior extreme reading of -6.68 rather than a structural stabilization. - Internal Tension: The positive momentum metric conflicts with the deeply negative absolute flow levels and the bearish 3-week moving average (-1.99).
- Conditional Invalidation: A recovery in
trend_confirm_shareabove 0.30 alongside stabilizing absolute flows.
Scenario Balance:
- Base Case dominant: Continued downward pressure as negative flow shares (0.67) dwarf positive counterparts.
- Upside risk: Mean reversion triggered by the recent sharp positive turn in flow momentum.
- Downside risk: Further liquidation if
crowded_short_share(0.17) continues to expand from current levels.
Time Horizon & Aggregation:
- Time Horizon: Tactical (weeks); speculative flows in the Rates sector exhibit high velocity and frequent reversals (1).
- Aggregation Weight Hint: Medium; while volatile, the sharp drop in trend confirmation is a significant lead indicator for regime changes.
Macro Relevance:
- This signal informs the pricing and sentiment dimension, specifically regarding speculative appetite for interest rate duration.
- Economic mechanism: Speculative capital is rapidly exiting previous positions, implying a shift in liquidity preferences or a reassessment of the rate cycle.
- Cycle position: Not determined.
- Interacts with Sector Positioning to validate whether these flow shifts represent broader institutional de-risking (1).
Regime Context:
- The signal is in a newly entered transition phase, moving away from the more stable expansionary flows observed in mid-May.
- Direction of change: Deteriorating, as evidenced by the significant drop in
n_marketsand negative average flow trends.
Model Limitations:
- Susceptible to noise from contract rolls and lacks statistical normalization via z-scores (1).
Data & References:
- Forward Indicators of Economic Cycles (Momentum of Flows): 2026-06-09 (1).
- Most influential:
trend_confirm_share(0.08) andavg_flow_4w(-2.71). - Public datasets: CFTC Commitments of Traders (CoT) reports and primary dealer treasury positioning.
Sector Flow & Momentum Chart
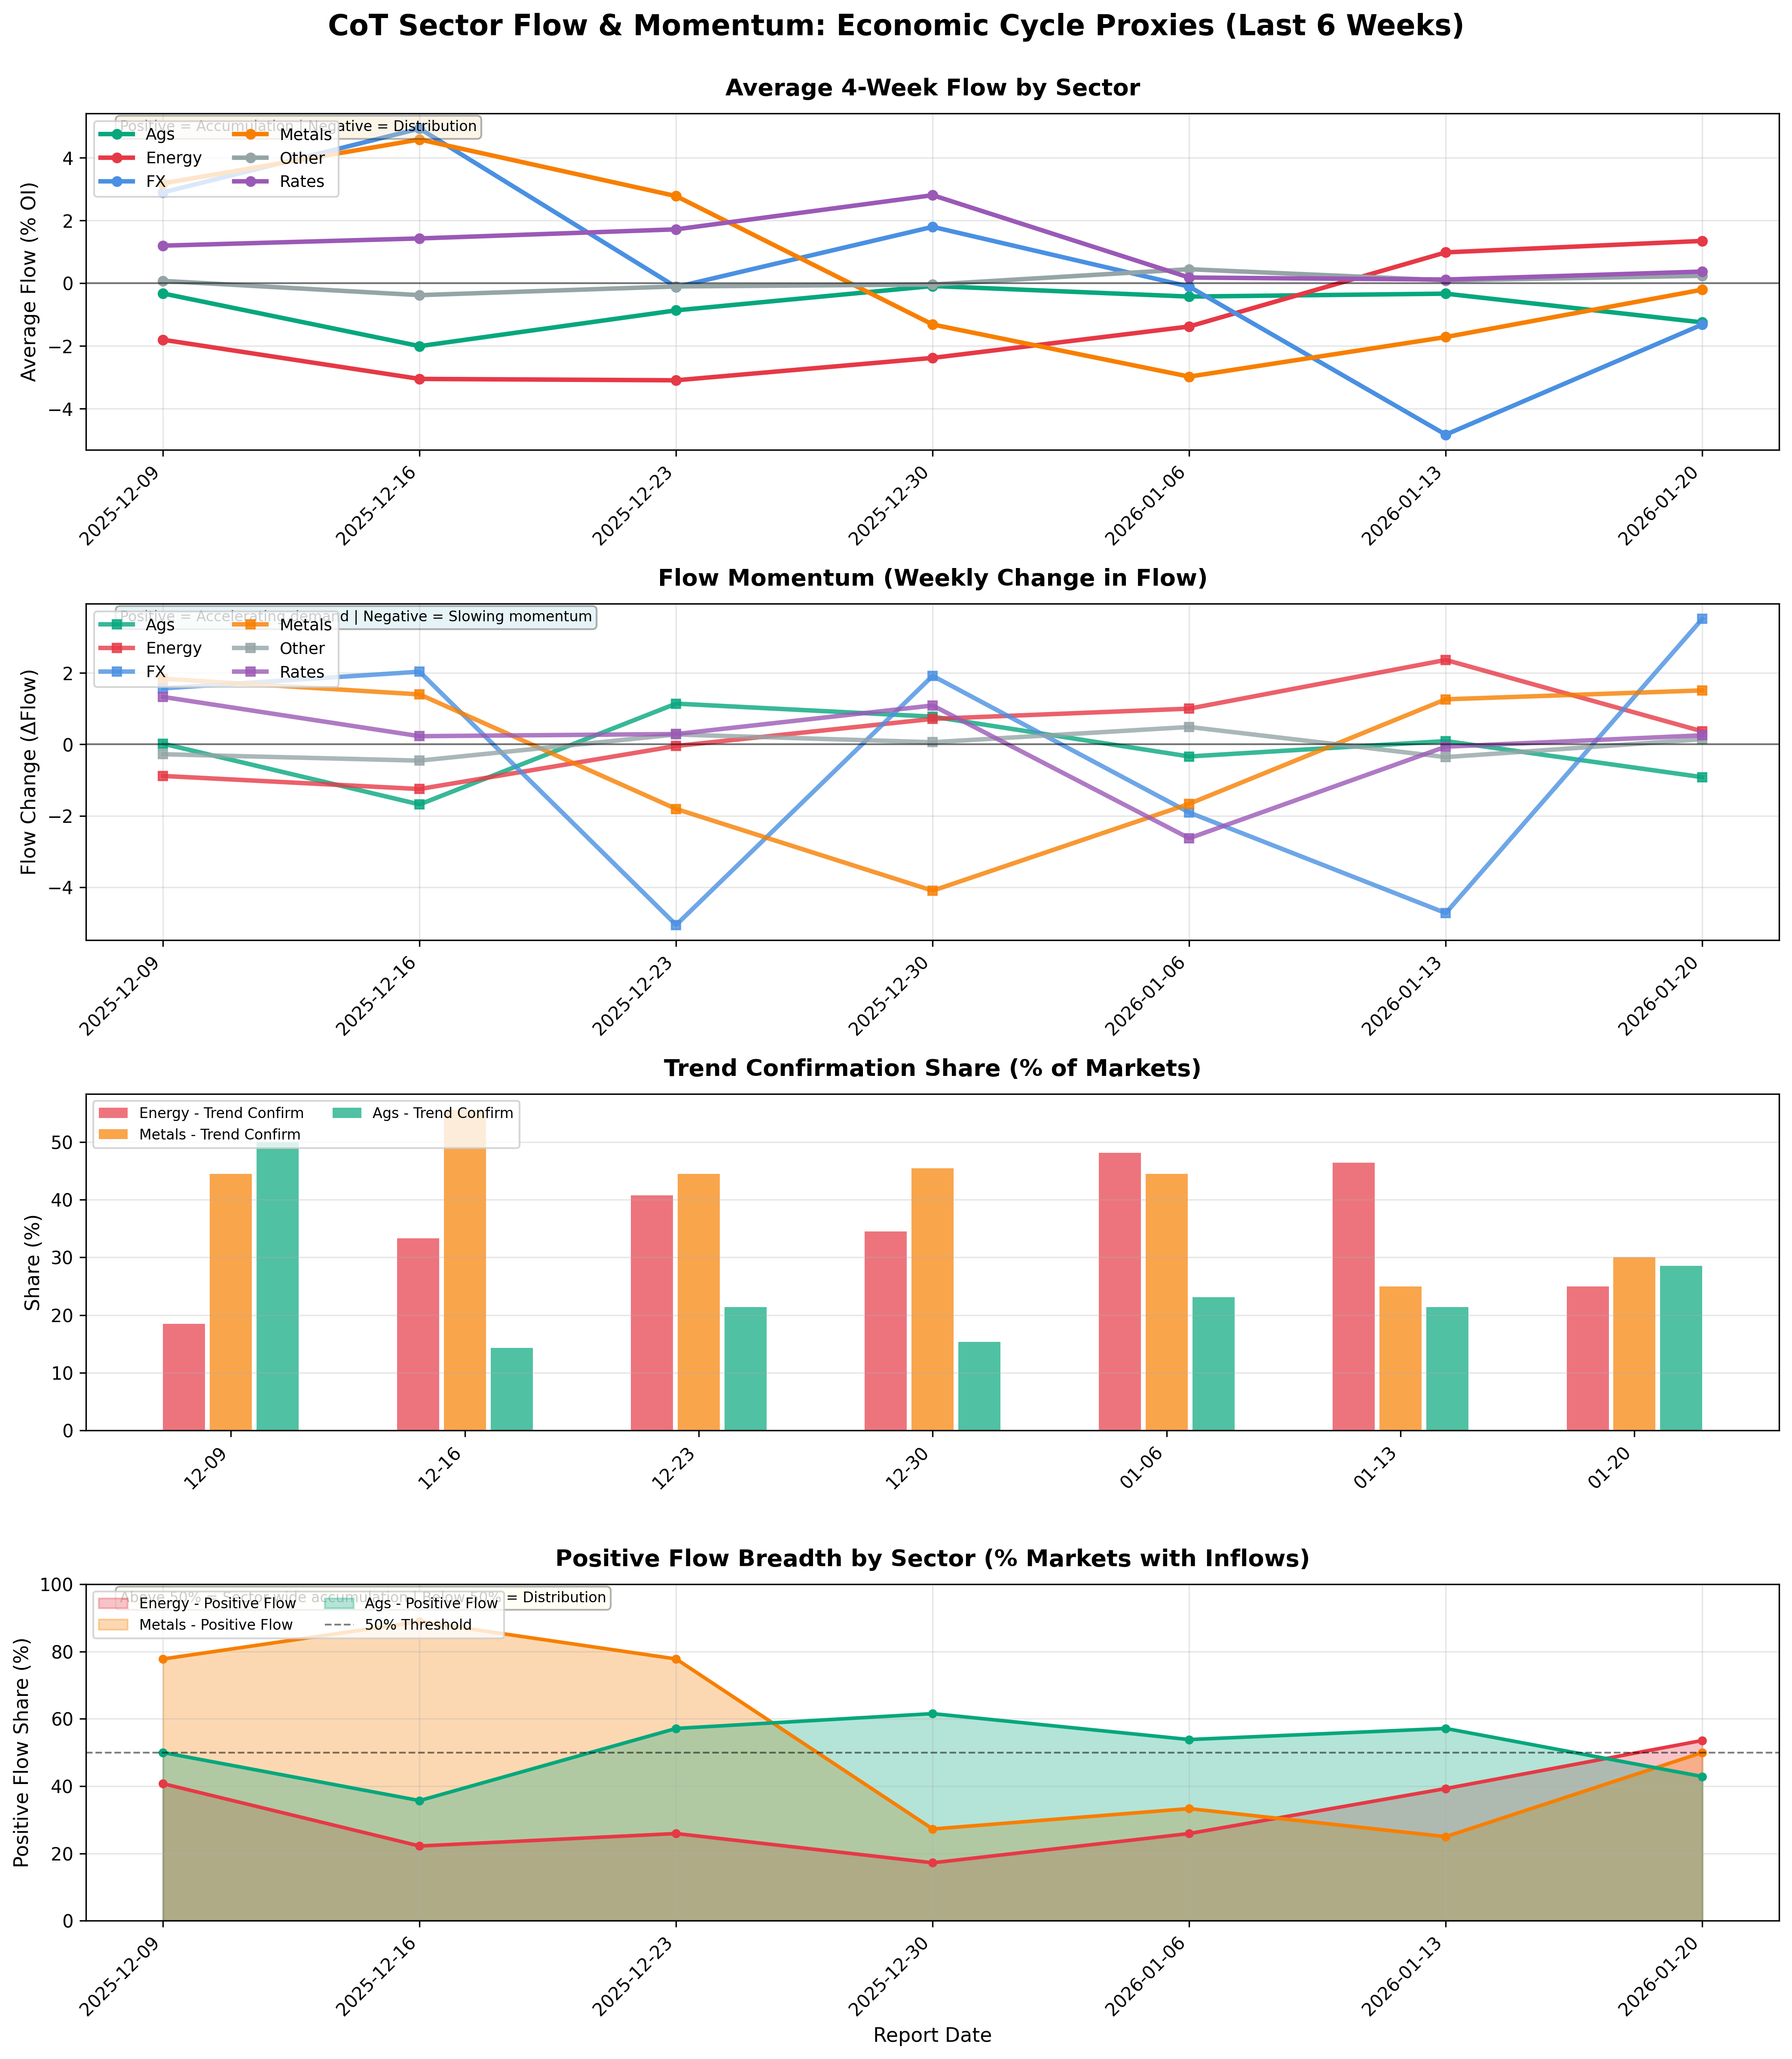
Sector-level flow and momentum as proxies for economic cycles.
Sector Flow & Momentum Table▸
The information on this website is provided for general informational and educational purposes only and does not constitute financial, investment, legal, or tax advice. It does not take into account any individual objectives, financial situation, or needs.
All views expressed are personal, based on publicly available information, and do not represent the views of any employer or reflect any proprietary or internal analysis. This information should not be relied upon for making investment decisions.
No representation or warranty is made as to the accuracy, completeness, or timeliness of the information, and no liability is accepted for any loss arising directly or indirectly from its use.
All views expressed are personal, based on publicly available information, and do not represent the views of any employer or reflect any proprietary or internal analysis. This information should not be relied upon for making investment decisions.
No representation or warranty is made as to the accuracy, completeness, or timeliness of the information, and no liability is accepted for any loss arising directly or indirectly from its use.