Durable Goods ex-Transportation Signal
Core durable goods demand excluding transportation volatility.
Gemini Summary
Signal Summary:
- Configuration statement: Given the absence of reported values for YoY_pct and 3M_pct, this setup aligns with Indeterminate price paths and Indeterminate volatility, where the dominant risk is Data uncertainty, not trend continuation.
- The current state is unclassified due to a lack of observation data in the provided dataset (1).
- Conviction Band: Low; Interpretation Confidence: Low Confidence; Internal Conflict Flag: Yes.
Methodology Applied:
- A Bullish regime is triggered if YoY_pct exceeds +5% or 3M_pct exceeds +1% (1).
- A Bearish regime is classified if YoY_pct falls below -3% or 3M_pct falls below -1% (1).
- The signal utilizes Manufacturer’s New Orders (ADXTNO) to strip transportation volatility and capture core demand (1).
- Durable Goods ex-Transportation Signal (1): latest observation date not provided.
Key Dynamics:
- Main quantitative drivers: The interaction between YoY growth and 3-month momentum of core durable goods orders.
- Current state: Indeterminate; the signal cannot verify if manufacturing demand is firming or softening without level data.
- Internal tensions: Missing data prevents the calculation of the robust z-score (YoY_z) used for historical scaling.
- Conditional Invalidation: A confirmed 3M_pct value below -1% would force an immediate Bearish classification.
Scenario Balance:
- Base case dominant; risks balanced.
- Upside risk: A return to core order growth >5% YoY, suggesting a re-acceleration in manufacturing.
- Downside risk: A contraction in core orders below -3% YoY, flagging a cyclical slowdown.
Time Horizon & Aggregation:
- Time Horizon: Cyclical (months) as core durable goods reflect intermediate business investment cycles.
- Aggregation Weight Hint: Low, necessitated by current data gaps and the resulting low confidence score.
Macro Relevance:
- Macro dimension: Measures capital expenditure momentum and core real-sector demand.
- Cycle position: Mid-to-late cycle indicator, providing a lead on industrial activity.
- Interaction: Typically converges with the Capex Intent Signal (2) and Industrial Production Signal (3).
Data & References:
- FRED Series ADXTNO (Manufacturers' New Orders: Durable Goods Excluding Transportation): date not provided.
- Data timeliness cannot be assessed; Data Freshness: Unknown.
- Additional reliability would be gained from incorporating ISM Manufacturing New Orders data.
Durable Goods ex-Transportation Chart
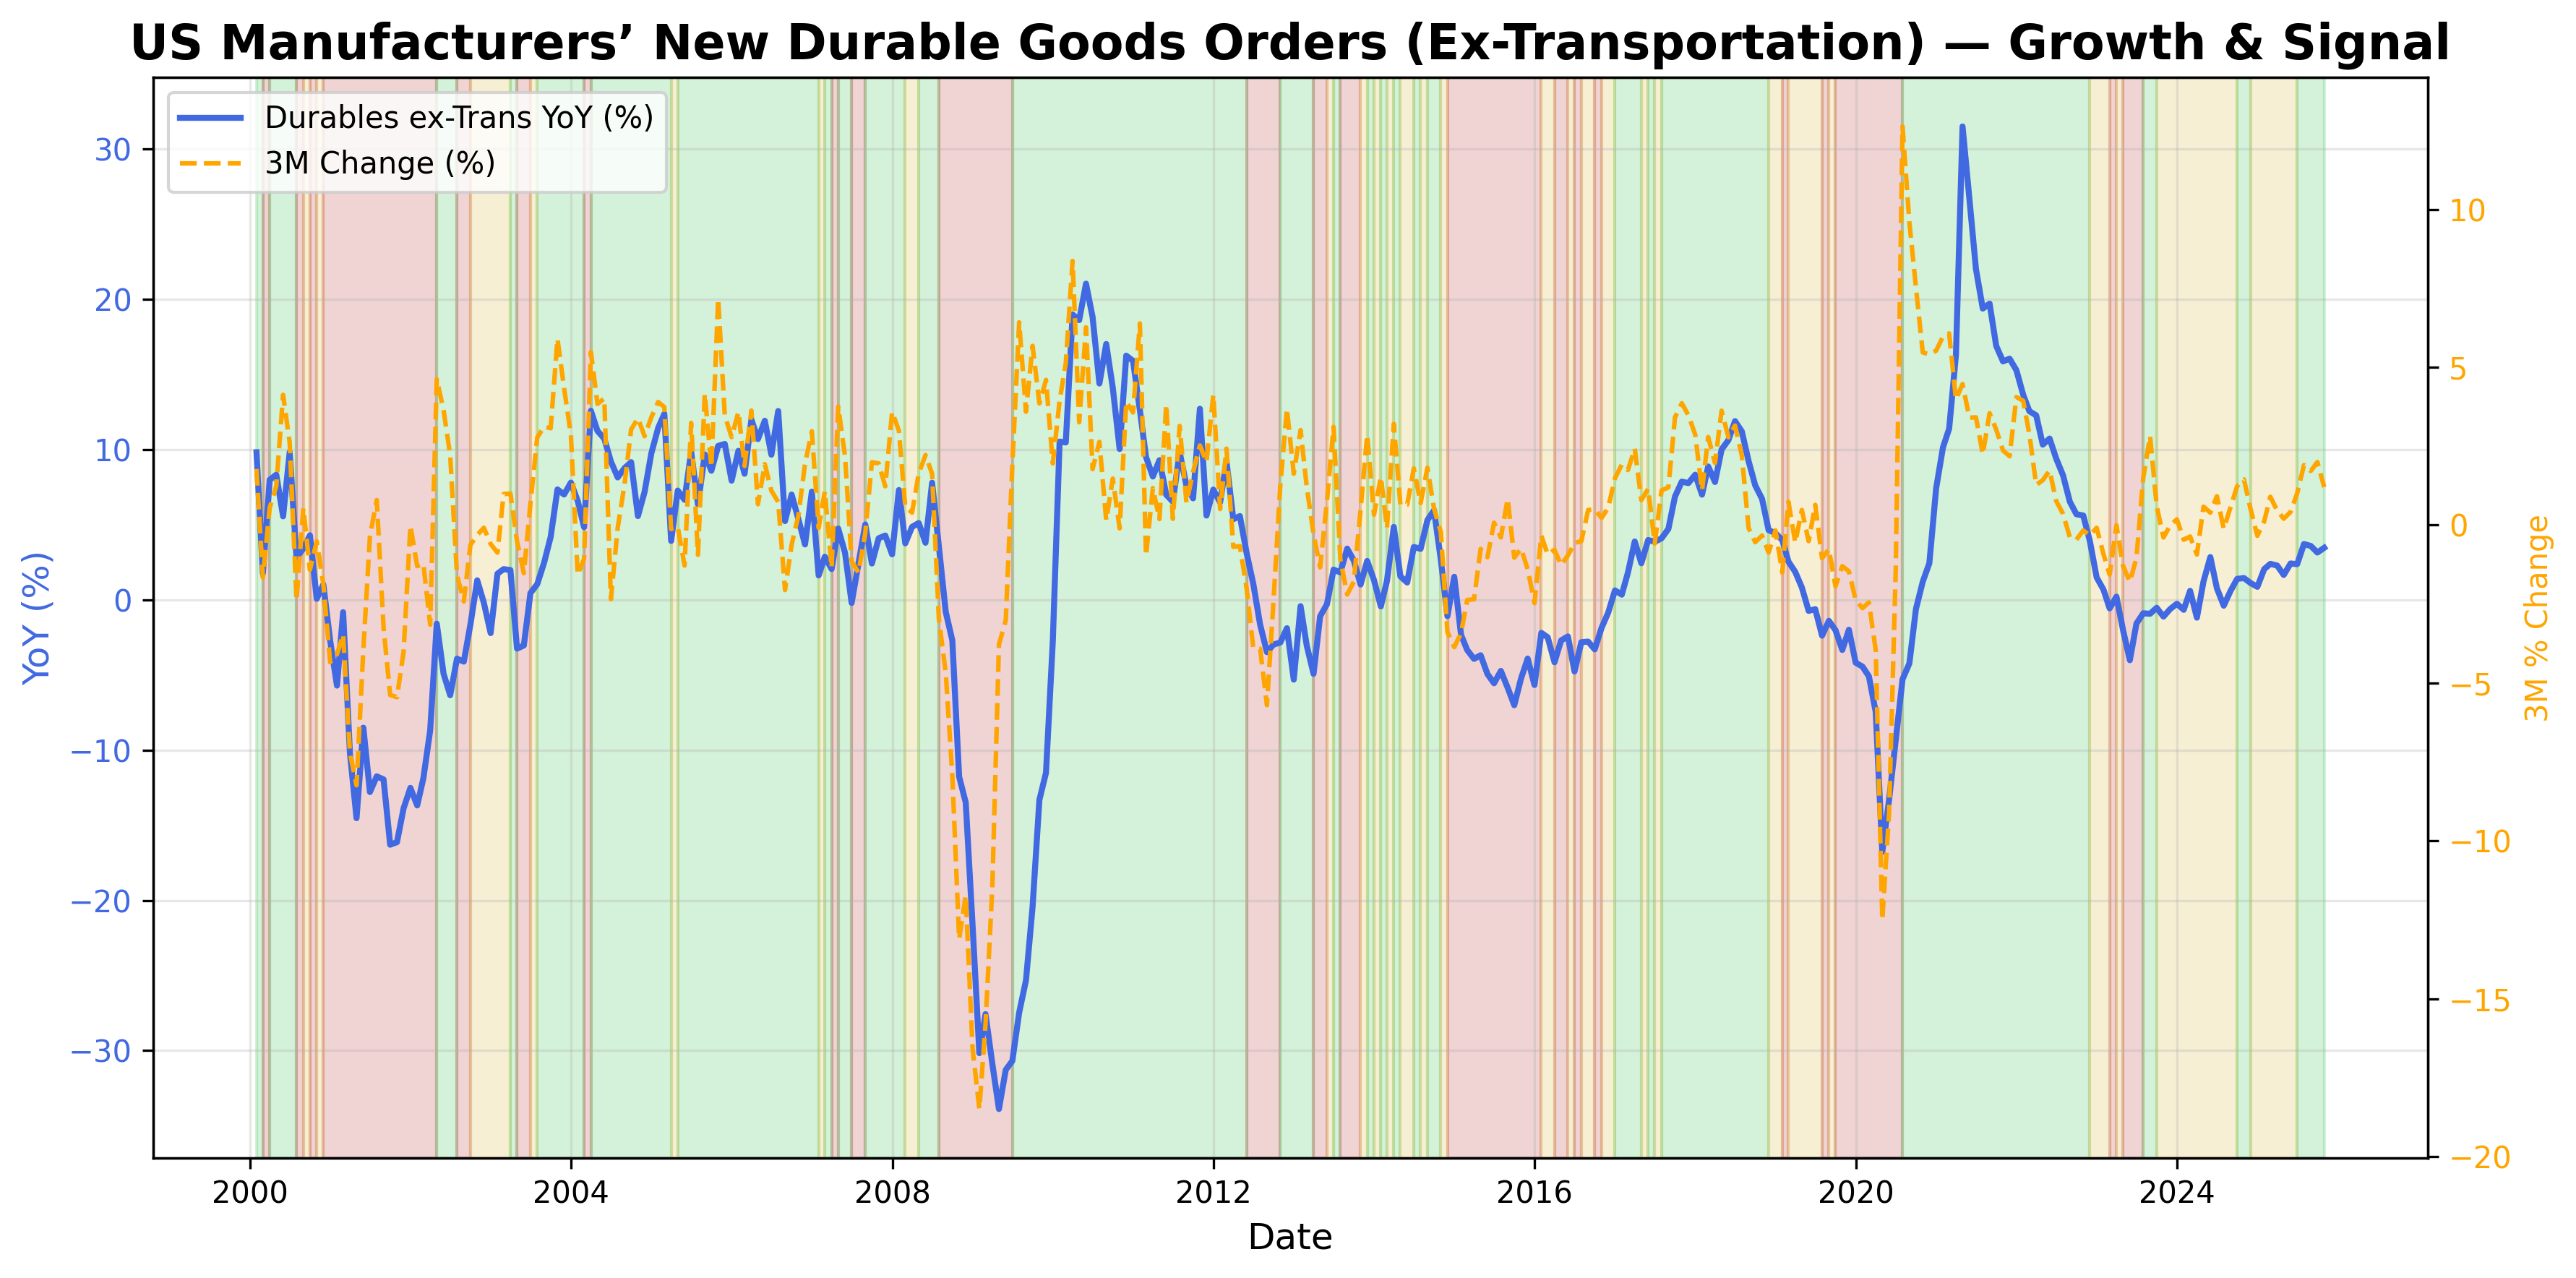
Durable goods orders excluding transportation equipment.
Durable Goods ex-Transportation Table▸
The information presented is for general informational purposes only and does not constitute financial or investment advice. It has been prepared without regard to individual objectives, financial situation, or needs. You should consider whether it is appropriate for your circumstances and seek independent advice where necessary.