Cross-Sector Positioning
CoT sector positioning vs history.
Gemini Summary
Signal Summary:
- Configuration statement (mandatory): Given Metals speculative crowding at 0.444 and Energy short crowding at 0.444, this setup aligns with Range-biased price paths and Elevated volatility, where the dominant risk is Mean reversion, not Trend continuation. (1)
- The signal identifies active speculative crowding in Metals, while Rates have recently exited a crowded state, suggesting sector-specific exhaustion. (1)
- Conviction Band: Medium. Interpretation Confidence: High Confidence. Internal Conflict Flag: No. Signal Stability Assessment: Volatile. Threshold Proximity: Near. Revision Sensitivity: Unknown.
Methodology Applied:
- Speculative crowding (broad_spec_crowding) ≥ 0.40 indicates extreme consensus and high risk of trend exhaustion. (1)
- Unwind risk (broad_unwind_risk) ≥ 0.30 signals high probability of short squeezes or long liquidations. (1)
- Cross-Sector Positioning dataset: latest observation 2026-06-09. (1)
Key Dynamics:
- Metals speculative crowding remains active at 0.444, maintaining a mean-reversion bias. (1)
- Energy and FX exhibit high concentration (0.44-0.46) in crowded shorts, nearing broader sector-wide flags. (1)
- Rates positioning stabilized rapidly, with crowding falling from 0.41 to 0.08 in two weeks. (1)
- Conditional Invalidation: A rise in
broad_unwind_riskabove 0.30 would trigger a shift to liquidation risk. (1) - Signal stability is low due to rapid positioning shifts observed in the Rates sector. (1)
Scenario Balance:
- Base case dominant: Mean reversion in Metals and Energy as speculative momentum exhausts.
- Upside risk: Trend continuation if commercial hedger pressure remains below 0.40.
- Downside risk: Forced liquidation if unwind risk metrics breach thresholds across multiple sectors.
Time Horizon & Aggregation:
- Time Horizon: Tactical (weeks), reflecting the weekly frequency and lagging nature of CoT positioning data. (1)
- Aggregation Weight Hint: High, as positioning extremes are primary drivers of technical reversals. (1)
Macro Relevance:
- Informs the Sentiment and Positioning dimension, specifically identifying systemic imbalances. (1)
- Transmission mechanism involves speculative flow exhaustion leading to price reversals. (1)
- Cycle position: Not determined.
- Interacts with trend signals to identify high-risk entry points at exhaustion levels. (1)
Regime Context:
- Metals regime is persistent, remaining in broad speculative crowding for two consecutive reporting periods. (1)
- Rates underwent a weakening transition, moving from a crowded to a neutral state. (1)
Model Limitations:
- Lagging nature of Commitments of Traders (CoT) data and potential noise in illiquid markets. (1)
Data & References:
Sector Positioning Chart
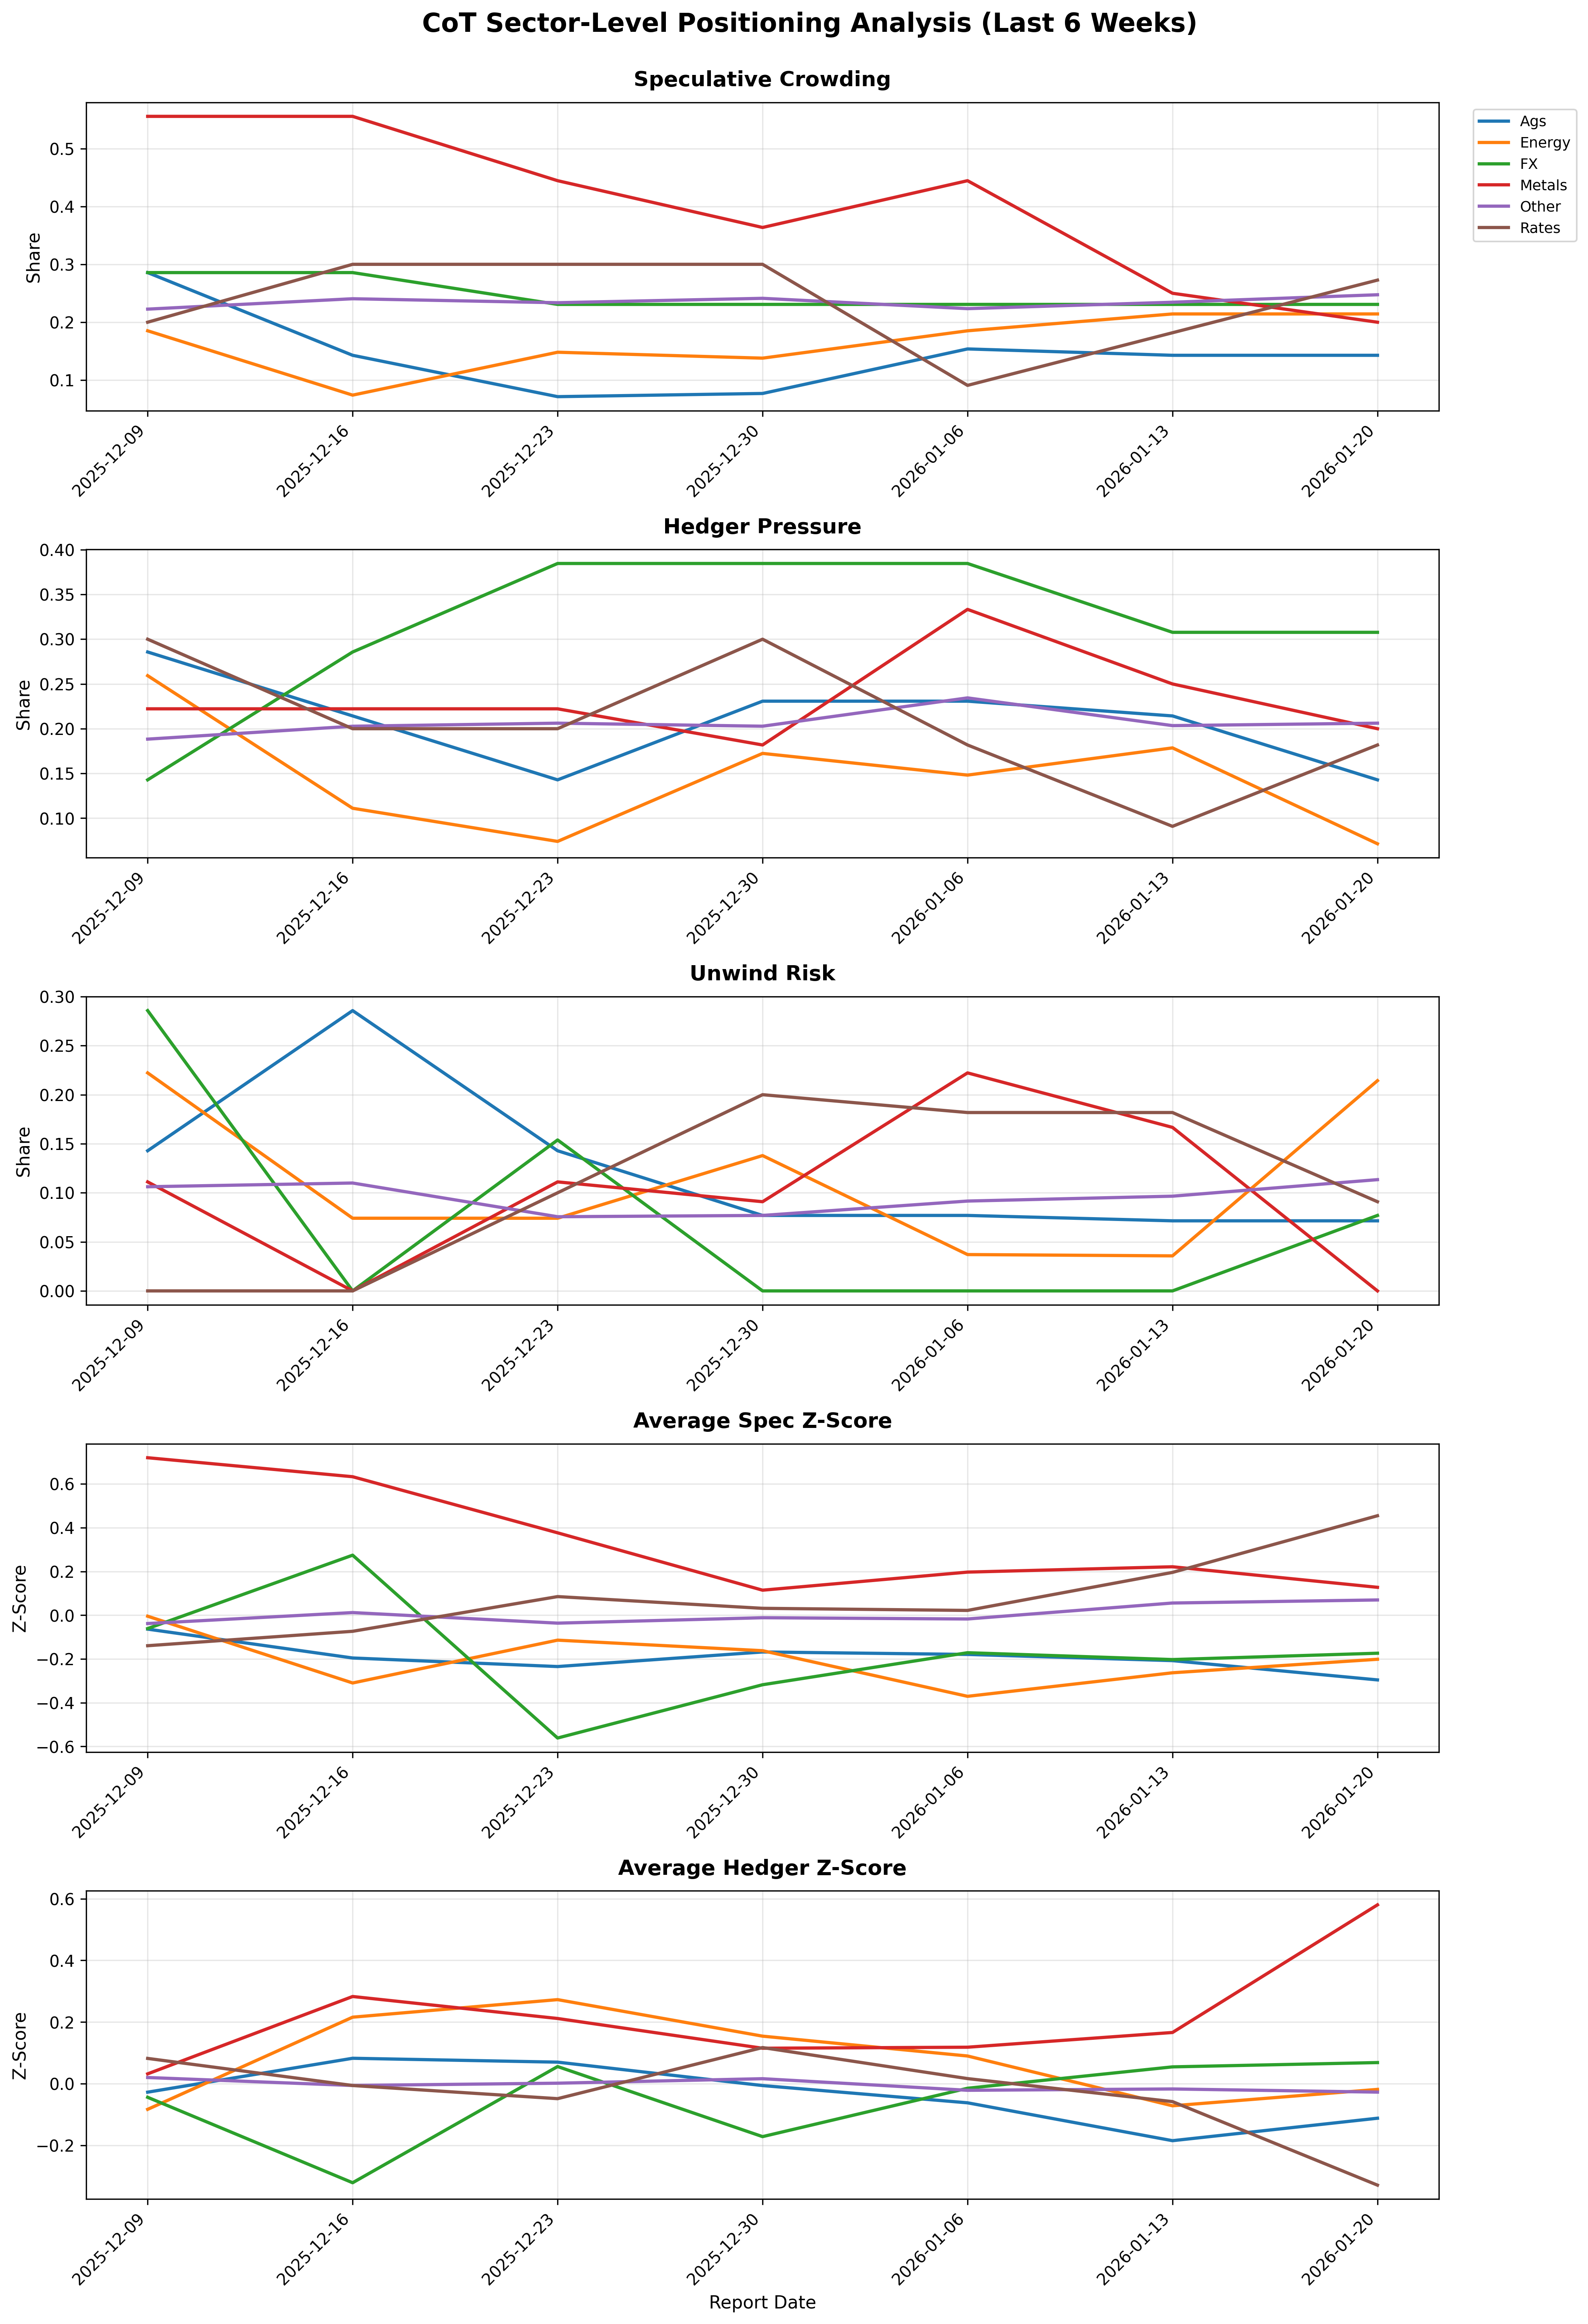
Net speculative positioning by sector vs 5-year history.
Cross-Sector Positioning Table▸
The information on this website is provided for general informational and educational purposes only and does not constitute financial, investment, legal, or tax advice. It does not take into account any individual objectives, financial situation, or needs.
All views expressed are personal, based on publicly available information, and do not represent the views of any employer or reflect any proprietary or internal analysis. This information should not be relied upon for making investment decisions.
No representation or warranty is made as to the accuracy, completeness, or timeliness of the information, and no liability is accepted for any loss arising directly or indirectly from its use.
All views expressed are personal, based on publicly available information, and do not represent the views of any employer or reflect any proprietary or internal analysis. This information should not be relied upon for making investment decisions.
No representation or warranty is made as to the accuracy, completeness, or timeliness of the information, and no liability is accepted for any loss arising directly or indirectly from its use.