University of Michigan Consumer Sentiment Signal
Consumer confidence and expectations as a forward demand indicator.
Gemini Summary
Signal Summary:
- Configuration statement: Given a UMCSENT level of 49.8 and a Level_z of -1.00, this setup aligns with Downward-biased price paths and Indeterminate volatility, where the dominant risk is Regime shift, not Mean reversion (1).
- The signal is currently in a Bearish regime, characterized by significantly depressed sentiment and negative momentum (1).
- Conviction Band: High; Interpretation Confidence: High Confidence; Internal Conflict Flag: No. Signal Stability Assessment: Deteriorating; Threshold Proximity: Far; Revision Sensitivity: Unknown.
Methodology Applied:
- A Bearish regime is triggered when Level_z is below -0.75 and 3M momentum is below -1% (1).
- Sentiment measures serve as a demand backdrop and proxy for future household consumption growth (1).
- Divergence between Level_z and momentum metrics typically signals an impending regime transition (1).
- University of Michigan Consumer Sentiment Signal: Latest observation April 30, 2026 (1).
Key Dynamics:
- The primary driver is the Level_z of -1.0016, which is well below the -0.75 bearish threshold (1).
- Negative 3-month momentum (-11.7%) confirms the deteriorating trend rather than historical noise (1).
- Current sentiment indicates a persistent demand headwind for consumer-facing sectors (1).
- Conditional Invalidation: A 3-month momentum shift above +1.0% or Level_z rising above -0.75 (1).
- The signal has shown consistent bearishness since early 2025, demonstrating high persistence (1).
Scenario Balance:
- Base Case dominant: Continued contraction in household spending propensity due to depressed psychological sentiment.
- Upside risk: Mean reversion toward historical norms if inflation perceptions or labor conditions improve rapidly.
- Downside risk: Accelerated demand destruction if momentum deterioration exceeds -20% on a 3-month basis.
Time Horizon & Aggregation:
- Time Horizon: Cyclical (months) as sentiment trends reflect medium-term household consumption behavior (1).
- Aggregation Weight Hint: High, due to the high conviction of the bearish regime and multi-month persistence.
Macro Relevance:
- Informs the Consumer Demand and Pricing power dimensions of macro aggregation (1).
- Economic mechanism: Sentiment acts as a lead indicator for household consumption; negative values imply disinflationary pressure and economic slowdown (1).
- Cycle position: Not determined.
- Typically confirms labor market data and credit growth signals (1).
Regime Context:
- The Bearish regime is persistent, having been maintained for over 12 months (1).
- Direction of change: Strengthening bearishness as UMCSENT levels recently fell to new cycle lows (1).
Model Limitations:
- High month-to-month volatility and sensitivity to non-economic news may produce noise (1).
- Potential for survey methodology shifts to impact long-term comparability (1).
Data & References:
Consumer Sentiment Chart
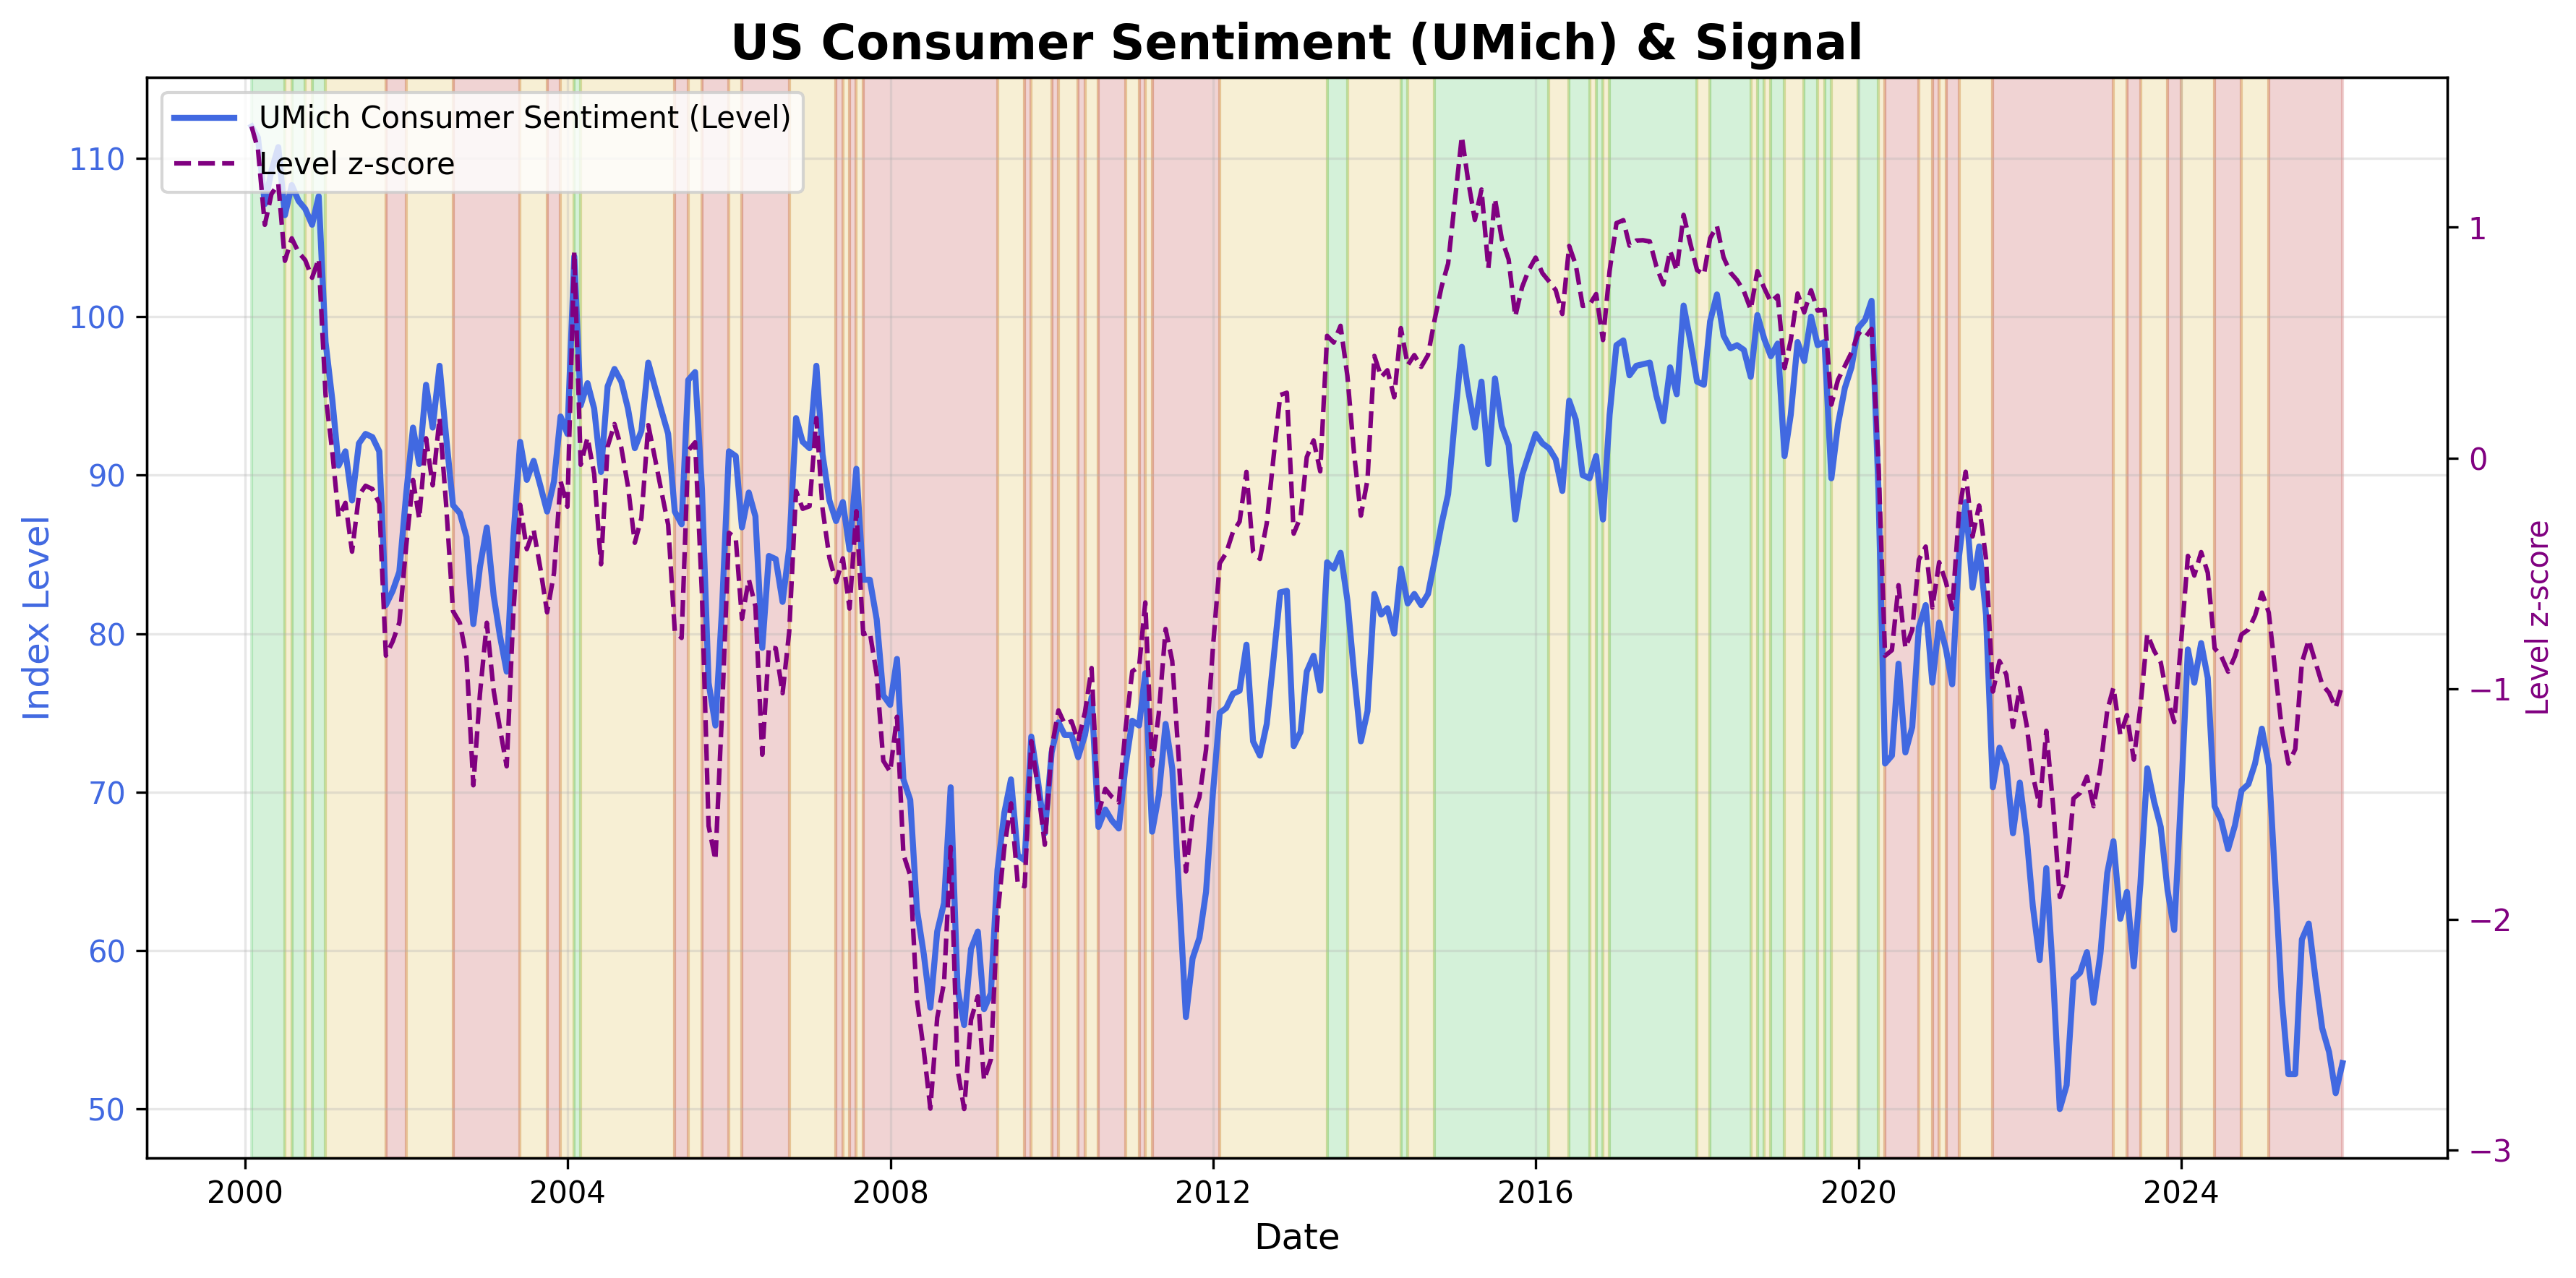
University of Michigan Consumer Sentiment Index.
Consumer Sentiment Table▸
The information on this website is provided for general informational and educational purposes only and does not constitute financial, investment, legal, or tax advice. It does not take into account any individual objectives, financial situation, or needs.
All views expressed are personal, based on publicly available information, and do not represent the views of any employer or reflect any proprietary or internal analysis. This information should not be relied upon for making investment decisions.
No representation or warranty is made as to the accuracy, completeness, or timeliness of the information, and no liability is accepted for any loss arising directly or indirectly from its use.
All views expressed are personal, based on publicly available information, and do not represent the views of any employer or reflect any proprietary or internal analysis. This information should not be relied upon for making investment decisions.
No representation or warranty is made as to the accuracy, completeness, or timeliness of the information, and no liability is accepted for any loss arising directly or indirectly from its use.