AUD - Individual Market Analysis
CoT signals and diagnostics for AUD futures.
Gemini Summary
Signal Summary:
- Configuration statement: Given a Speculator Z-score of 0.657 and an aggressive 4-week positioning flow of -23.5, this setup aligns with Transition-biased price paths and Normal volatility, where the dominant risk is Long liquidation, not short covering (1).
- The signal has transitioned from an extreme "Crowded Long" regime in March to a "Normal" synthetic state as of June 2026 (1).
- Conviction Band: High; Interpretation Confidence: High Confidence; Internal Conflict Flag: No. Signal Stability Assessment: Deteriorating; Threshold Proximity: Far; Revision Sensitivity: Low.
Methodology Applied:
- Speculator Z-Scores: Values between -2 and +2 define a neutral/early-trend regime, while extremes (>|2|) flag exhaustion or squeeze risks (1).
- 4-Week Positioning Flow: Multi-week flow reversals are interpreted as shifts in underlying global growth and commodity sentiment (1).
- Regime Bias: Falling positioning values indicate a global slowdown, risk-off sentiment, or commodity deflation (1).
- AUD - Individual Market Analysis (Latest observation: 2026-06-09) (1).
Key Dynamics:
- The primary driver is a massive 23.5% reduction in speculative net positioning over four weeks, signaling an aggressive exit from previous long bets (1).
- Momentum has shifted from "Long Build" to a sustained "Long Reduction" phase since mid-April (1).
- Conditional Invalidation: A reversal of flow back to "Long Build" or a Speculator Z-score crossing below -2.0 (1).
- Stability is low as the signal is in an active state of liquidation-driven transition (1).
Scenario Balance:
- Dominant base case: Continued price consolidation or drift as speculative sponsorship is removed.
- Upside risk: A "Squeeze Risk" trigger if speculators over-rotate to the short side (Z-score < -2).
- Downside risk: Accelerated sell-off if long liquidation triggers broader risk-off contagion.
Time Horizon & Aggregation:
- Time Horizon: Tactical (weeks); current dynamics reflect recent flow shifts rather than structural cycle peaks.
- Aggregation Weight Hint: Medium; positioning is now neutral, providing less asymmetric "stretch" for macro models.
Macro Relevance:
- Informs global risk appetite and commodity cycle momentum (1).
- Economic mechanism: The downward shift in positioning implies a cooling of the global growth impulse and China-related optimism (1).
- Cycle position: Not determined.
Regime Context:
- Transition from persistent "Crowded Long" (March) to "Normal" (June) (1).
- Direction: Weakening speculative conviction as long positions are liquidated (1).
Model Limitations:
- Weekly CoT data contains a reporting lag; persistent extremes can remain during strong trends (1).
Data & References:
AUD CoT Diagnostics Chart
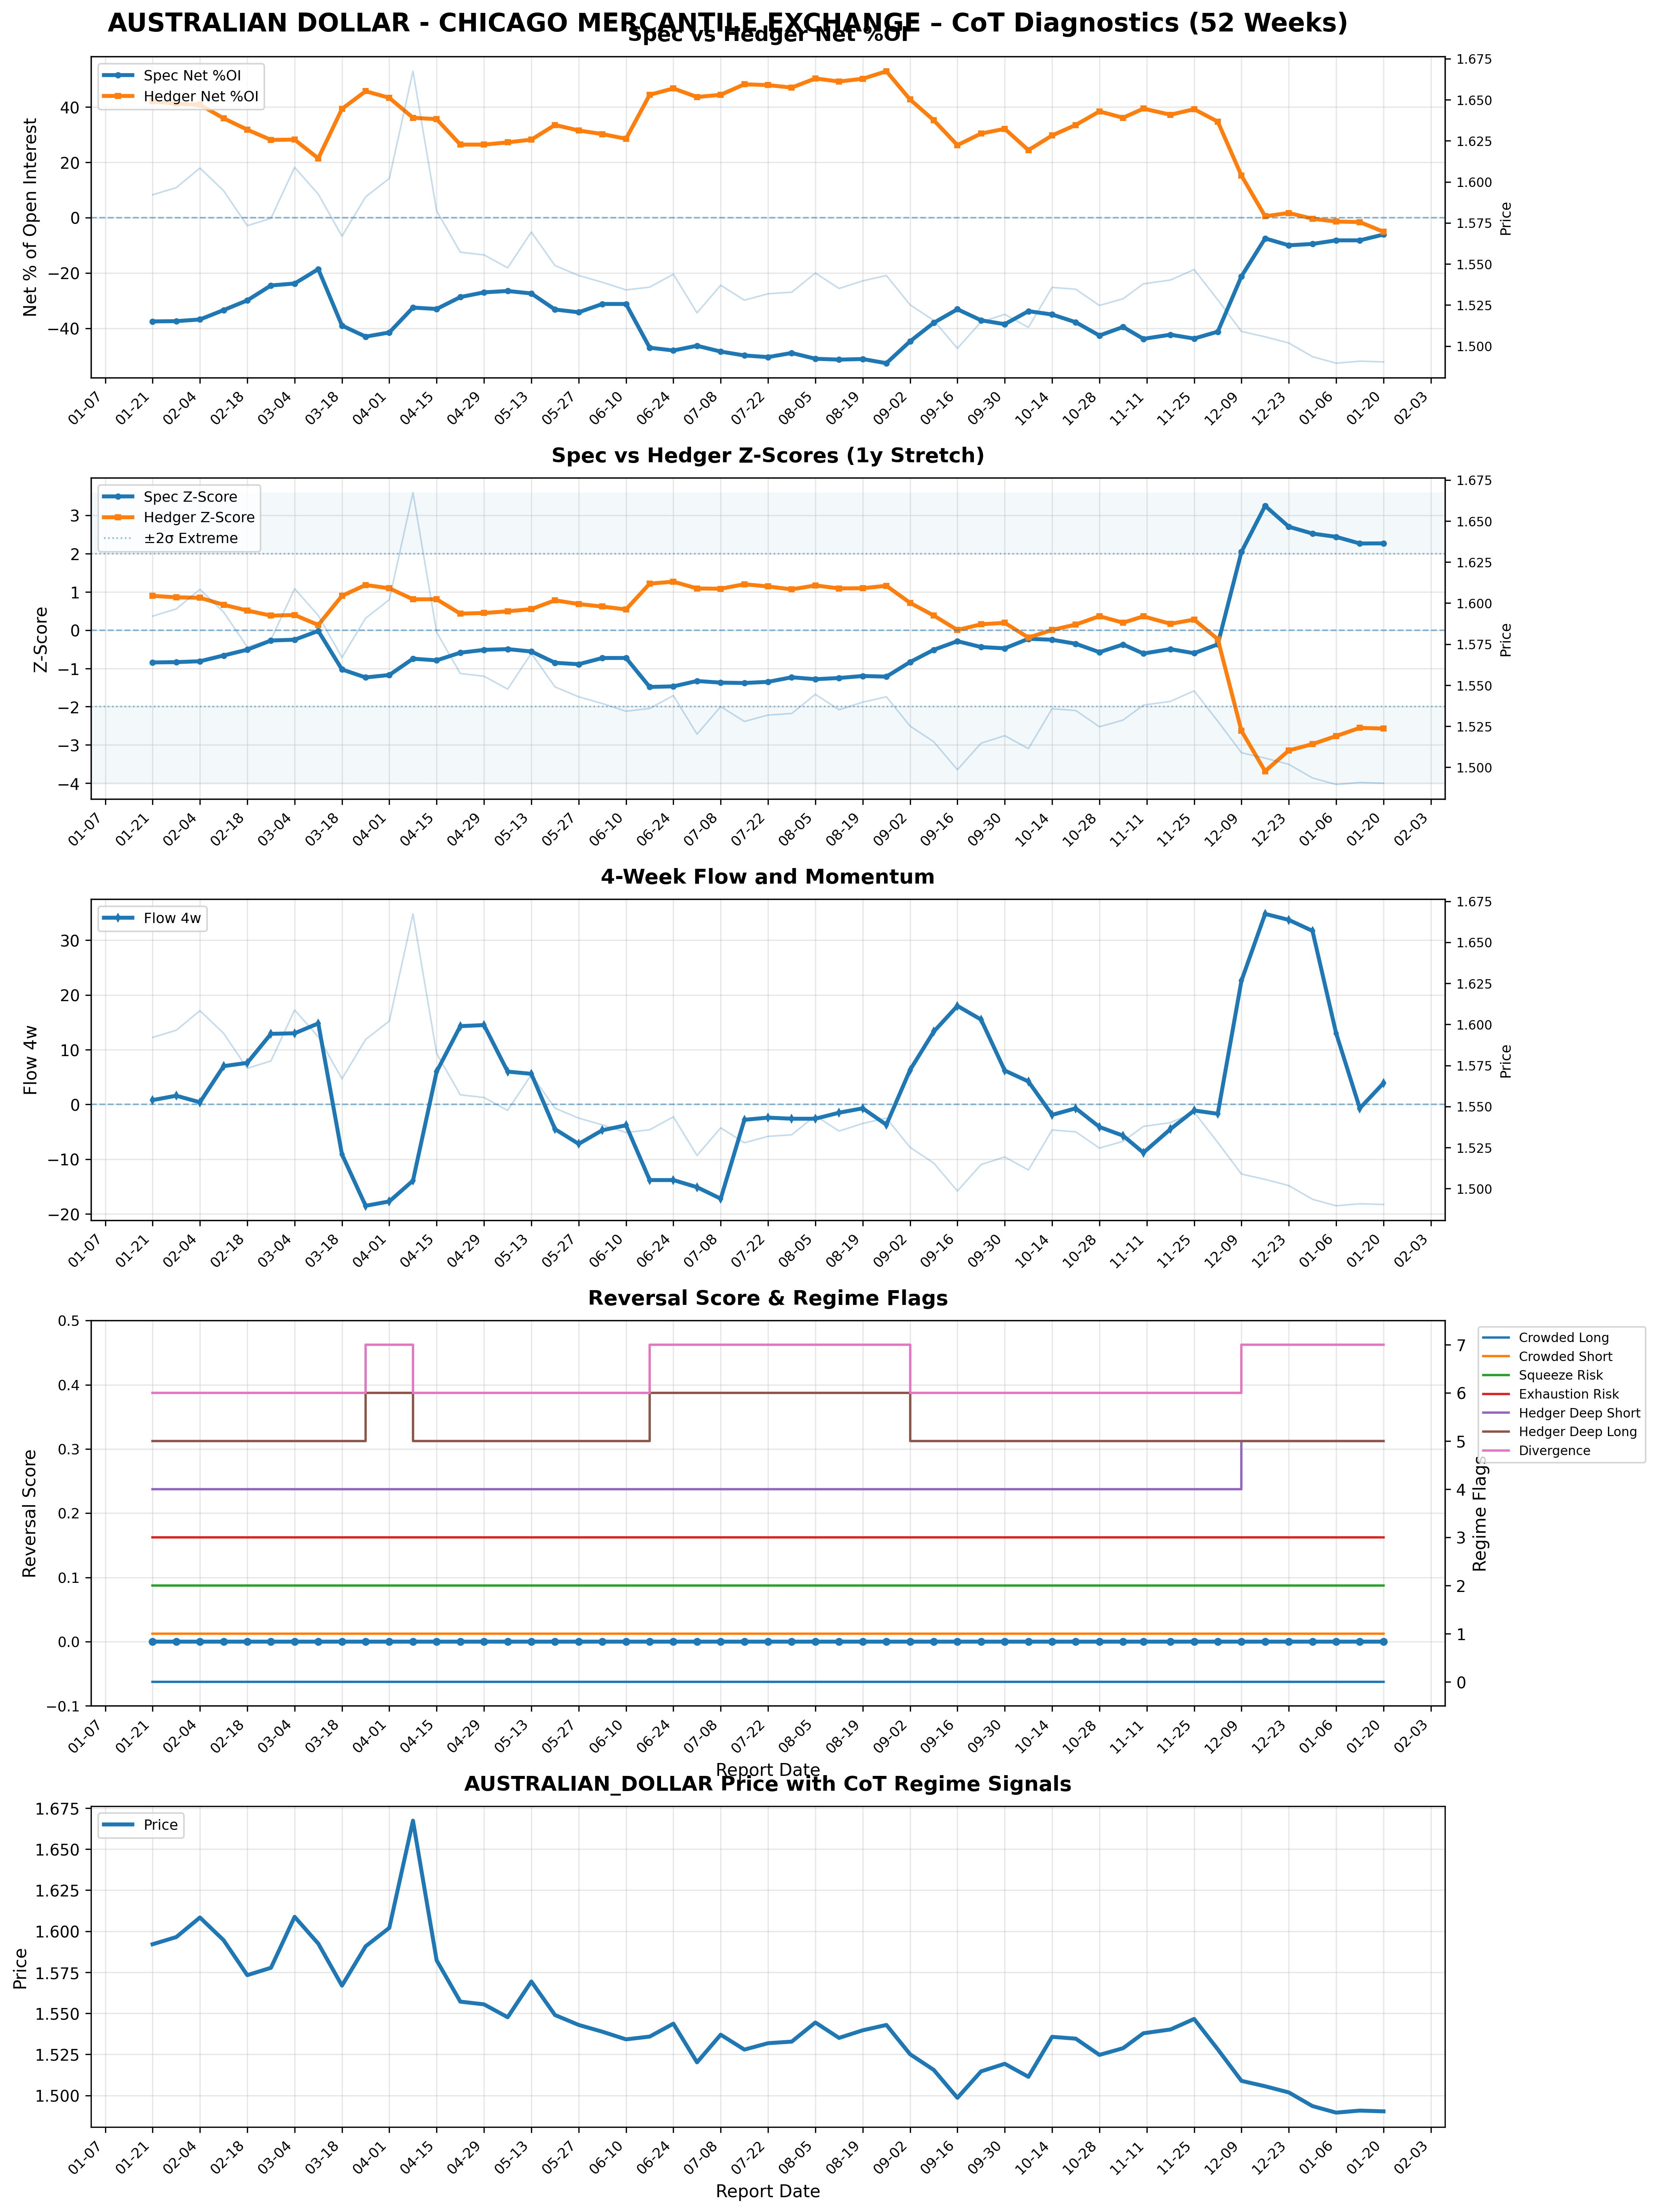
AUD futures: CoT diagnostics, positioning, crowding, reversal risk, and price overlay.
AUD CoT Signals Table▸
The information on this website is provided for general informational and educational purposes only and does not constitute financial, investment, legal, or tax advice. It does not take into account any individual objectives, financial situation, or needs.
All views expressed are personal, based on publicly available information, and do not represent the views of any employer or reflect any proprietary or internal analysis. This information should not be relied upon for making investment decisions.
No representation or warranty is made as to the accuracy, completeness, or timeliness of the information, and no liability is accepted for any loss arising directly or indirectly from its use.
All views expressed are personal, based on publicly available information, and do not represent the views of any employer or reflect any proprietary or internal analysis. This information should not be relied upon for making investment decisions.
No representation or warranty is made as to the accuracy, completeness, or timeliness of the information, and no liability is accepted for any loss arising directly or indirectly from its use.