Gemini Summary

Signal Summary:

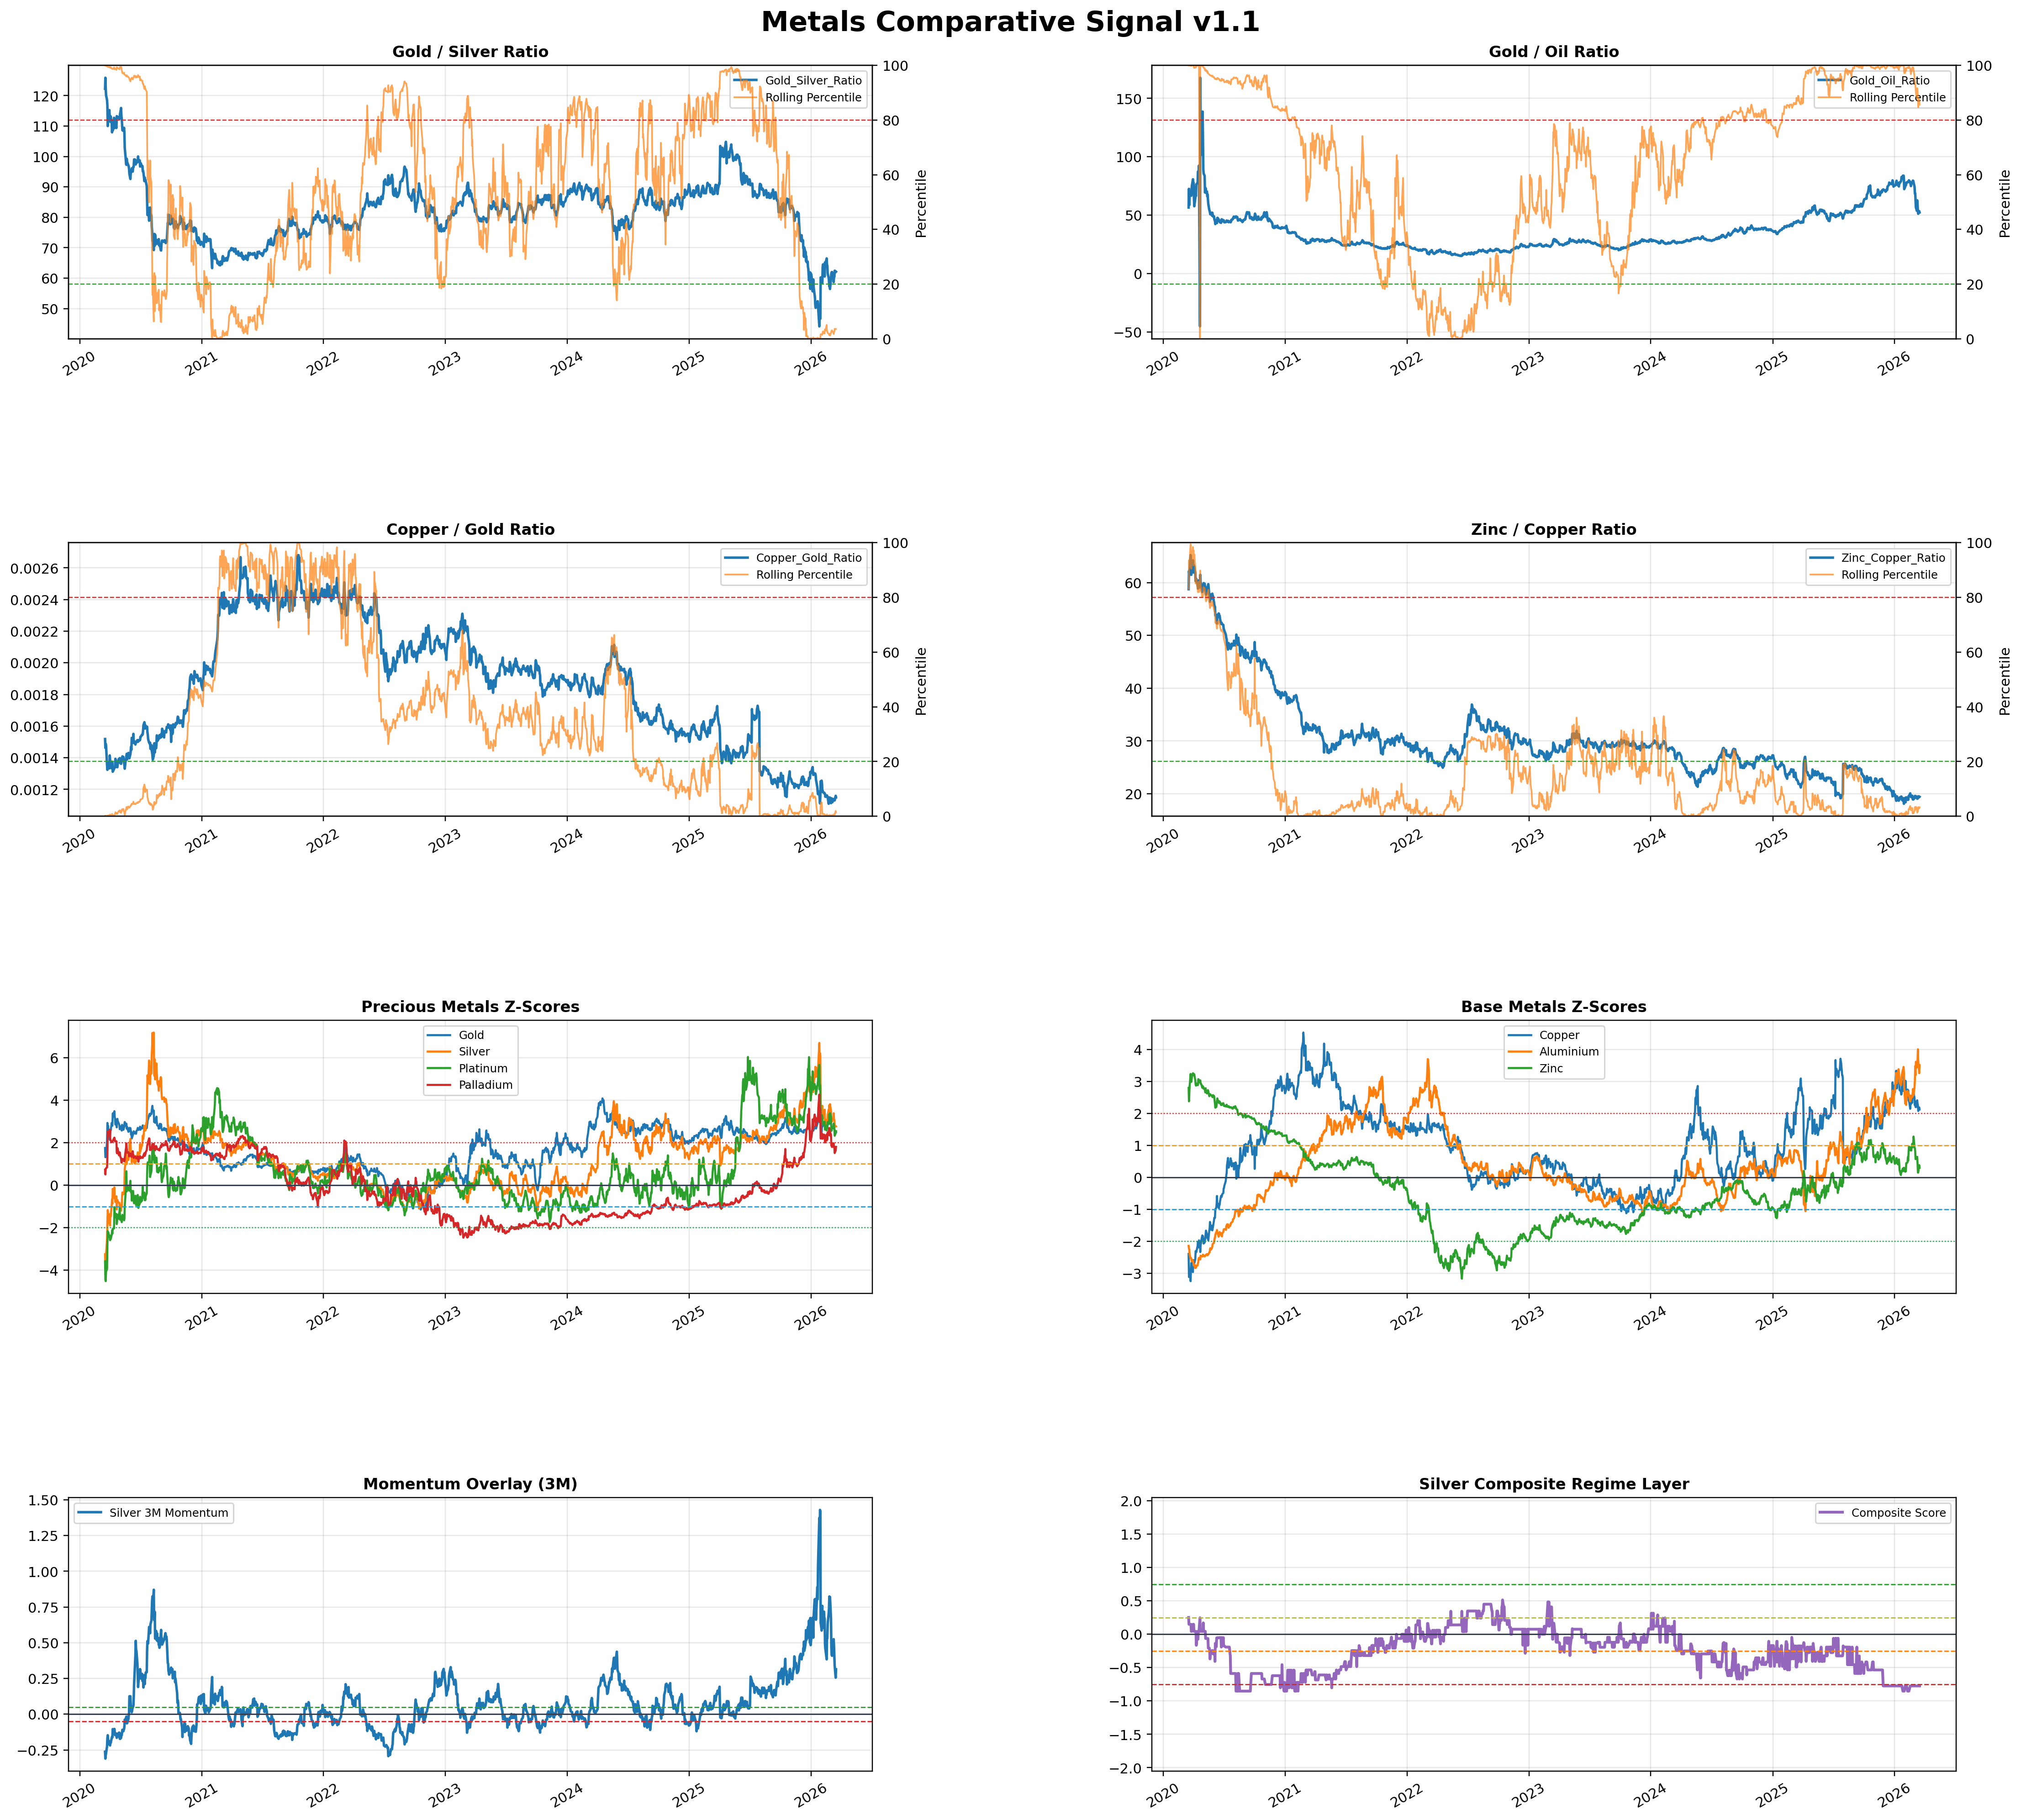
  • Configuration statement: Given extreme Z-scores for Aluminium (3.506) and Silver (2.764) alongside a -0.775 composite score, this setup aligns with Downward-biased price paths and Elevated volatility, where the dominant risk is Mean reversion, not Trend continuation.
  • The signal is currently in a Strong Outflow Bias regime, characterized by broad sector exhaustion and extreme valuation stretch.
  • Conviction Band: High; Interpretation Confidence: High Confidence; Internal Conflict Flag: No. Signal Stability Assessment: Deteriorating; Threshold Proximity: Far; Revision Sensitivity: Unknown.

Methodology Applied:

  • Standardisation Layer: Individual signals are governed by Z-scores; values exceeding 2.0 trigger "Strong Sell" classifications (1).
  • Relative Value Layer: Aggregates rolling percentiles of metal ratios; a -1.0 score indicates sector-wide overvaluation (2).
  • Macro Adjustment: Neutral USD strength (factor 1.0) ensures the outflow bias is driven by underlying metal price exhaustion rather than currency effects (3).
  • Dataset: Metals Comparative Matrix (Observation: 2026-03-17).

Key Dynamics:

  • Main drivers: Extreme Z-scores in Aluminium (3.506), Silver (2.764), Platinum (2.541), and Gold (2.488) mandate "Strong Sell" flags due to mean-reversion pressure (1)(2).
  • Momentum: 3M momentum (0.314) remains positive but is failing to support current price levels, creating a bearish divergence with valuation layers.
  • Internal Offset: Zinc remains the sole outlier (Z-score 0.296, "HOLD"), suggesting relative stability compared to the broader complex.
  • Conditional Invalidation: Reversion of the Composite Score to > -0.5 or a shift in the Regime to "Neutral."

Scenario Balance:

  • Base Case dominant: Systematic mean reversion as prices retreat from extreme Z-score territory.
  • Downside secondary: Outflow bias accelerates into a liquidation event if support levels (e.g., Gold 5000) fail.
  • Upside residual: Sudden USD weakness or supply disruptions forcing a further "overbought" extension.

Time Horizon & Aggregation:

  • Tactical (weeks): High Z-scores typically precede near-term price corrections or consolidation.
  • Aggregation Weight Hint: High due to uniform "Strong Sell" signals across 85% of the monitored complex.

Macro Relevance:

  • Informs the pricing and sentiment macro dimensions (4).
  • Economic mechanism: Demand exhaustion; extreme price levels are currently detached from historical norms, suggesting a cooling in cyclical demand impulse.
  • Cycle position: Not determined.

Regime Context:

  • The regime is newly persistent; prices have declined steadily since early March (Gold falling from 5294 to 5009).
  • Direction of change: Strengthening outflow bias as more metals enter the "Strong Sell" standardisation zone.

Model Limitations:

  • Relies on rolling historical percentiles which may lag in "new era" structural shifts.
  • Momentum overlay may generate late signals during high-velocity price reversals.

Data & References:

  • Latest observation: 2026-03-17.
  • Influential points: Aluminium Price (3363.25) and Gold_Silver_Ratio Percentile (96.5%).
  • Additional data: Monitoring Copper CoT and Gold CoT for positioning-led squeeze risks would improve reliability.

Metals Comparative Dashboard v1.1

Signal chart

Rolling relative value, z-score, momentum, and macro-adjusted composite layers.

Source Data Table

Latest Signal Classification

Metal Price ZScore Signal Confidence
Zinc 111.8594 0.296 HOLD 0.148
Aluminium 3363.2500 3.506 STRONG SELL 1.000
Copper 5.7555 2.117 STRONG SELL 1.000
Gold 5009.0000 2.488 STRONG SELL 1.000
Palladium 1630.0000 1.803 STRONG SELL 0.902
Platinum 2129.5000 2.541 STRONG SELL 1.000
Silver 80.6400 2.764 STRONG SELL 1.000

Composite Signal Layer

AsOf RelativeValueLayer StandardisationLayer MomentumLayer Momentum3M USDStrength MacroFactor ScorePreMacro CompositeScore Regime
2026-03-17 -1.0 -1.0 0.5 0.314168 neutral 1.0 -0.775 -0.775 Strong Outflow Bias

Recent Price History (15 rows)

Ticker Date Gold Silver Platinum Palladium Copper Aluminium Zinc Oil
2026-02-25 5206.3999 90.939 2325.6001 1834.1 5.9795 3081.75 113.1719 65.42
2026-02-26 5176.5000 86.998 2230.7000 1748.6 5.9470 3071.75 113.4219 65.21
2026-02-27 5230.5000 92.682 2365.6001 1792.2 6.0045 3044.25 113.8594 67.02
2026-03-02 5294.3999 88.284 2311.8999 1762.6 5.8945 3109.25 113.1562 71.23
2026-03-03 5107.3999 82.923 2074.8000 1635.0 5.7735 3165.75 113.1094 74.56
2026-03-04 5120.2002 82.633 2154.7000 1667.8 5.8550 3279.75 112.9062 74.66
2026-03-05 5065.2998 81.687 2130.0000 1620.2 5.7530 3215.75 112.4219 81.01
2026-03-06 5146.1001 83.816 2142.3999 1631.7 5.7570 3327.50 112.5625 90.90
2026-03-09 5091.5000 84.032 2169.6001 1662.2 5.8005 3292.00 112.4844 94.77
2026-03-10 5229.7002 89.083 2235.0000 1668.7 5.9040 3322.00 112.5781 83.45
2026-03-11 5167.3999 85.065 2205.0000 1624.4 5.8455 3369.50 112.1250 87.25
2026-03-12 5115.7998 84.670 2160.0000 1621.9 5.8245 3464.00 111.5625 95.73
2026-03-13 5052.5000 80.914 2036.6000 1554.1 5.7145 3383.25 111.5625 98.71
2026-03-16 4994.0000 80.263 2089.5000 1584.5 5.7905 3289.50 112.0312 93.50
2026-03-17 5009.0000 80.640 2129.5000 1630.0 5.7555 3363.25 111.8594 95.76

Recent Ratio History (15 rows)

Ticker Date Gold_Silver_Ratio Gold_Silver_Ratio_RollingPercentile Gold_Oil_Ratio Gold_Oil_Ratio_RollingPercentile Copper_Gold_Ratio Copper_Gold_Ratio_RollingPercentile Zinc_Copper_Ratio Zinc_Copper_Ratio_RollingPercentile Silver_vs_Gold_Ratio Silver_vs_Platinum_Ratio Silver_vs_Copper_Ratio Silver_vs_Oil_Ratio
2026-02-25 57.2516 1.3492 79.5842 99.2857 0.0011 0.3175 18.9266 0.9524 0.0175 0.0391 15.2085 1.3901
2026-02-26 59.5014 1.9048 79.3820 99.1270 0.0011 0.4762 19.0721 1.2698 0.0168 0.0390 14.6289 1.3341
2026-02-27 56.4349 1.1905 78.0439 98.3333 0.0011 0.3175 18.9623 1.1111 0.0177 0.0392 15.4354 1.3829
2026-03-02 59.9701 2.1429 74.3282 95.7143 0.0011 0.2381 19.1969 2.0635 0.0167 0.0382 14.9774 1.2394
2026-03-03 61.5921 2.7778 68.5005 93.7302 0.0011 0.3175 19.5911 3.3333 0.0162 0.0400 14.3627 1.1122
2026-03-04 61.9631 3.0159 68.5802 93.7302 0.0011 0.3968 19.2837 2.3016 0.0161 0.0384 14.1132 1.1068
2026-03-05 62.0086 3.0952 62.5268 91.5873 0.0011 0.3968 19.5414 3.2540 0.0161 0.0384 14.1990 1.0084
2026-03-06 61.3976 2.6190 56.6128 89.7619 0.0011 0.3175 19.5523 3.4127 0.0163 0.0391 14.5590 0.9221
2026-03-09 60.5900 2.5397 53.7248 88.1746 0.0011 0.5556 19.3922 2.7778 0.0165 0.0387 14.4870 0.8867
2026-03-10 58.7059 1.7460 62.6687 91.6667 0.0011 0.3968 19.0681 1.3492 0.0170 0.0399 15.0886 1.0675
2026-03-11 60.7465 2.6984 59.2252 91.1111 0.0011 0.5556 19.1814 2.0635 0.0165 0.0386 14.5522 0.9750
2026-03-12 60.4205 2.5397 53.4399 87.6190 0.0011 0.7143 19.1540 1.7460 0.0166 0.0392 14.5369 0.8845
2026-03-13 62.4428 3.6508 51.1853 84.6825 0.0011 0.5556 19.5227 3.3333 0.0160 0.0397 14.1594 0.8197
2026-03-16 62.2204 3.5714 53.4118 87.5397 0.0012 1.9048 19.3474 2.8571 0.0161 0.0384 13.8612 0.8584
2026-03-17 62.1156 3.5714 52.3079 85.6349 0.0011 1.4286 19.4352 3.2540 0.0161 0.0379 14.0109 0.8421

Structured Output JSON

{
  "signal_id": "metals_comparative_signal",
  "as_of_date": "2026-03-17",
  "signals": {
    "relative_value": [
      {
        "name": "Silver_vs_Gold",
        "status": "Overvalued",
        "signal": -1.0,
        "rolling_percentile": 96.5079365079365
      },
      {
        "name": "Silver_vs_Platinum",
        "status": "Overvalued",
        "signal": -1.0,
        "rolling_percentile": 97.6984126984127
      },
      {
        "name": "Silver_vs_Copper",
        "status": "Overvalued",
        "signal": -1.0,
        "rolling_percentile": 97.53968253968253
      },
      {
        "name": "Silver_vs_Oil",
        "status": "Overvalued",
        "signal": -1.0,
        "rolling_percentile": 93.0952380952381
      }
    ],
    "standardisation": [
      {
        "metal": "Gold",
        "zscore": 2.4875456889105276,
        "signal": "STRONG SELL",
        "confidence": 1.0
      },
      {
        "metal": "Silver",
        "zscore": 2.764125678522578,
        "signal": "STRONG SELL",
        "confidence": 1.0
      },
      {
        "metal": "Platinum",
        "zscore": 2.541398435129441,
        "signal": "STRONG SELL",
        "confidence": 1.0
      },
      {
        "metal": "Palladium",
        "zscore": 1.803035271948628,
        "signal": "STRONG SELL",
        "confidence": 0.901517635974314
      },
      {
        "metal": "Copper",
        "zscore": 2.116993339128005,
        "signal": "STRONG SELL",
        "confidence": 1.0
      },
      {
        "metal": "Aluminium",
        "zscore": 3.506037207382759,
        "signal": "STRONG SELL",
        "confidence": 1.0
      },
      {
        "metal": "Zinc",
        "zscore": 0.2959372758622806,
        "signal": "HOLD",
        "confidence": 0.1479686379311403
      }
    ]
  },
  "composite_signal": {
    "relative_value_layer": -1.0,
    "standardisation_layer": -1.0,
    "momentum_layer": 0.5,
    "momentum_3m": 0.3141683783340212,
    "usd_strength": "neutral",
    "macro_adjustment_factor": 1.0,
    "score_pre_macro": -0.775,
    "score": -0.775,
    "regime": "Strong Outflow Bias"
  }
}
The information presented is for general informational purposes only and does not constitute financial or investment advice. It has been prepared without regard to individual objectives, financial situation, or needs. You should consider whether it is appropriate for your circumstances and seek independent advice where necessary.