Underemployment Risk Signal
Underemployment risk signal: assessing slack and under-utilisation in the labour market.
Gemini Summary
Signal Summary:
- Configuration statement (mandatory): Given `u6_underutilization_rate` at 8.4 and `median_weeks_unemployed` at 11.4, driving an `Underemployment_z` of 1.25 (above +0.75 threshold), this setup aligns with Downward-biased price paths and Elevated volatility, where the dominant risk is Trend continuation, not Regime shift.
- The current regime is classified as HOT (stress up), indicating broad labor market slack and elongated job-finding (1).
- Conviction: High, Interpretation Confidence: High Confidence, Internal Conflict Flag: No.
Methodology Applied:
- The HOT regime is identified when the unsmoothed `Underemployment_z` is greater than +0.75 (1).
- The `Underemployment_z` composite is an equal-weight average of robust rolling z-scores for `u6_underutilization_rate` and `median_weeks_unemployed` (1).
- Both input z-scores are considered "bad when high", contributing to increased stress (1).
- A HOT underemployment regime indicates broad slack and elongated job-finding, consistent with cooling demand (1).
Key Dynamics:
- The `Underemployment_z` is 1.25, significantly above the +0.75 threshold, firmly establishing a HOT (stress up) regime (1).
- This is driven by elevated `u6_underutilization_rate` (8.4%) and `median_weeks_unemployed` (11.4 weeks).
- Momentum indicators show `u6_mom_3m` at 0.3 and `weeks_mom_3m` at 1.3, suggesting increasing underutilization and job-finding duration (1).
- Conditional Invalidation: The interpretation would reverse if `Underemployment_z` falls below the +0.75 threshold, signaling a shift to a NEUTRAL regime.
Scenario Balance:
- Base Case dominant: Continued HOT regime with persistent labor market slack, supported by the elevated `Underemployment_z` and positive momentum in key components.
- Upside secondary: A transition to a NEUTRAL regime if `Underemployment_z` drops below +0.75, triggered by a material improvement in either U-6 or unemployment duration.
- Downside residual: A more pronounced deterioration, driven by significant increases in both `u6_underutilization_rate` and `median_weeks_unemployed`.
Time Horizon & Aggregation:
- Time Horizon: Cyclical (months), reflecting the measured pace of shifts in broad labor market conditions.
- Aggregation Weight Hint: High, given its direct reflection of labor market health and its broad implications for economic activity.
Macro Relevance:
- Macro dimension: This signal informs labor market tightness, consumer demand capacity, and potential disinflationary pressures (1).
- Cycle position: A HOT regime typically aligns with late-cycle dynamics or early-stage economic cooling.
- Typical interaction: Rising underemployment often precedes softening wage growth and could interact with signals like `Consumer_Sentiment` (2) or `US_Treasury_Yield_Curve` (3) in signaling broader economic deceleration.
Data & References:
- Underemployment Risk Signal (BLS CPS data), latest observation date 2025-12-01 (1).
- The `Underemployment_z` and `Underemployment_Regime` are most influential for the current state (1).
- `Job_Flows_Signal` (4) or `Labor_Market_Tightness_Signal` (5) would provide additional depth on labor market dynamism and tightness.
Underemployment Risk Signal Chart
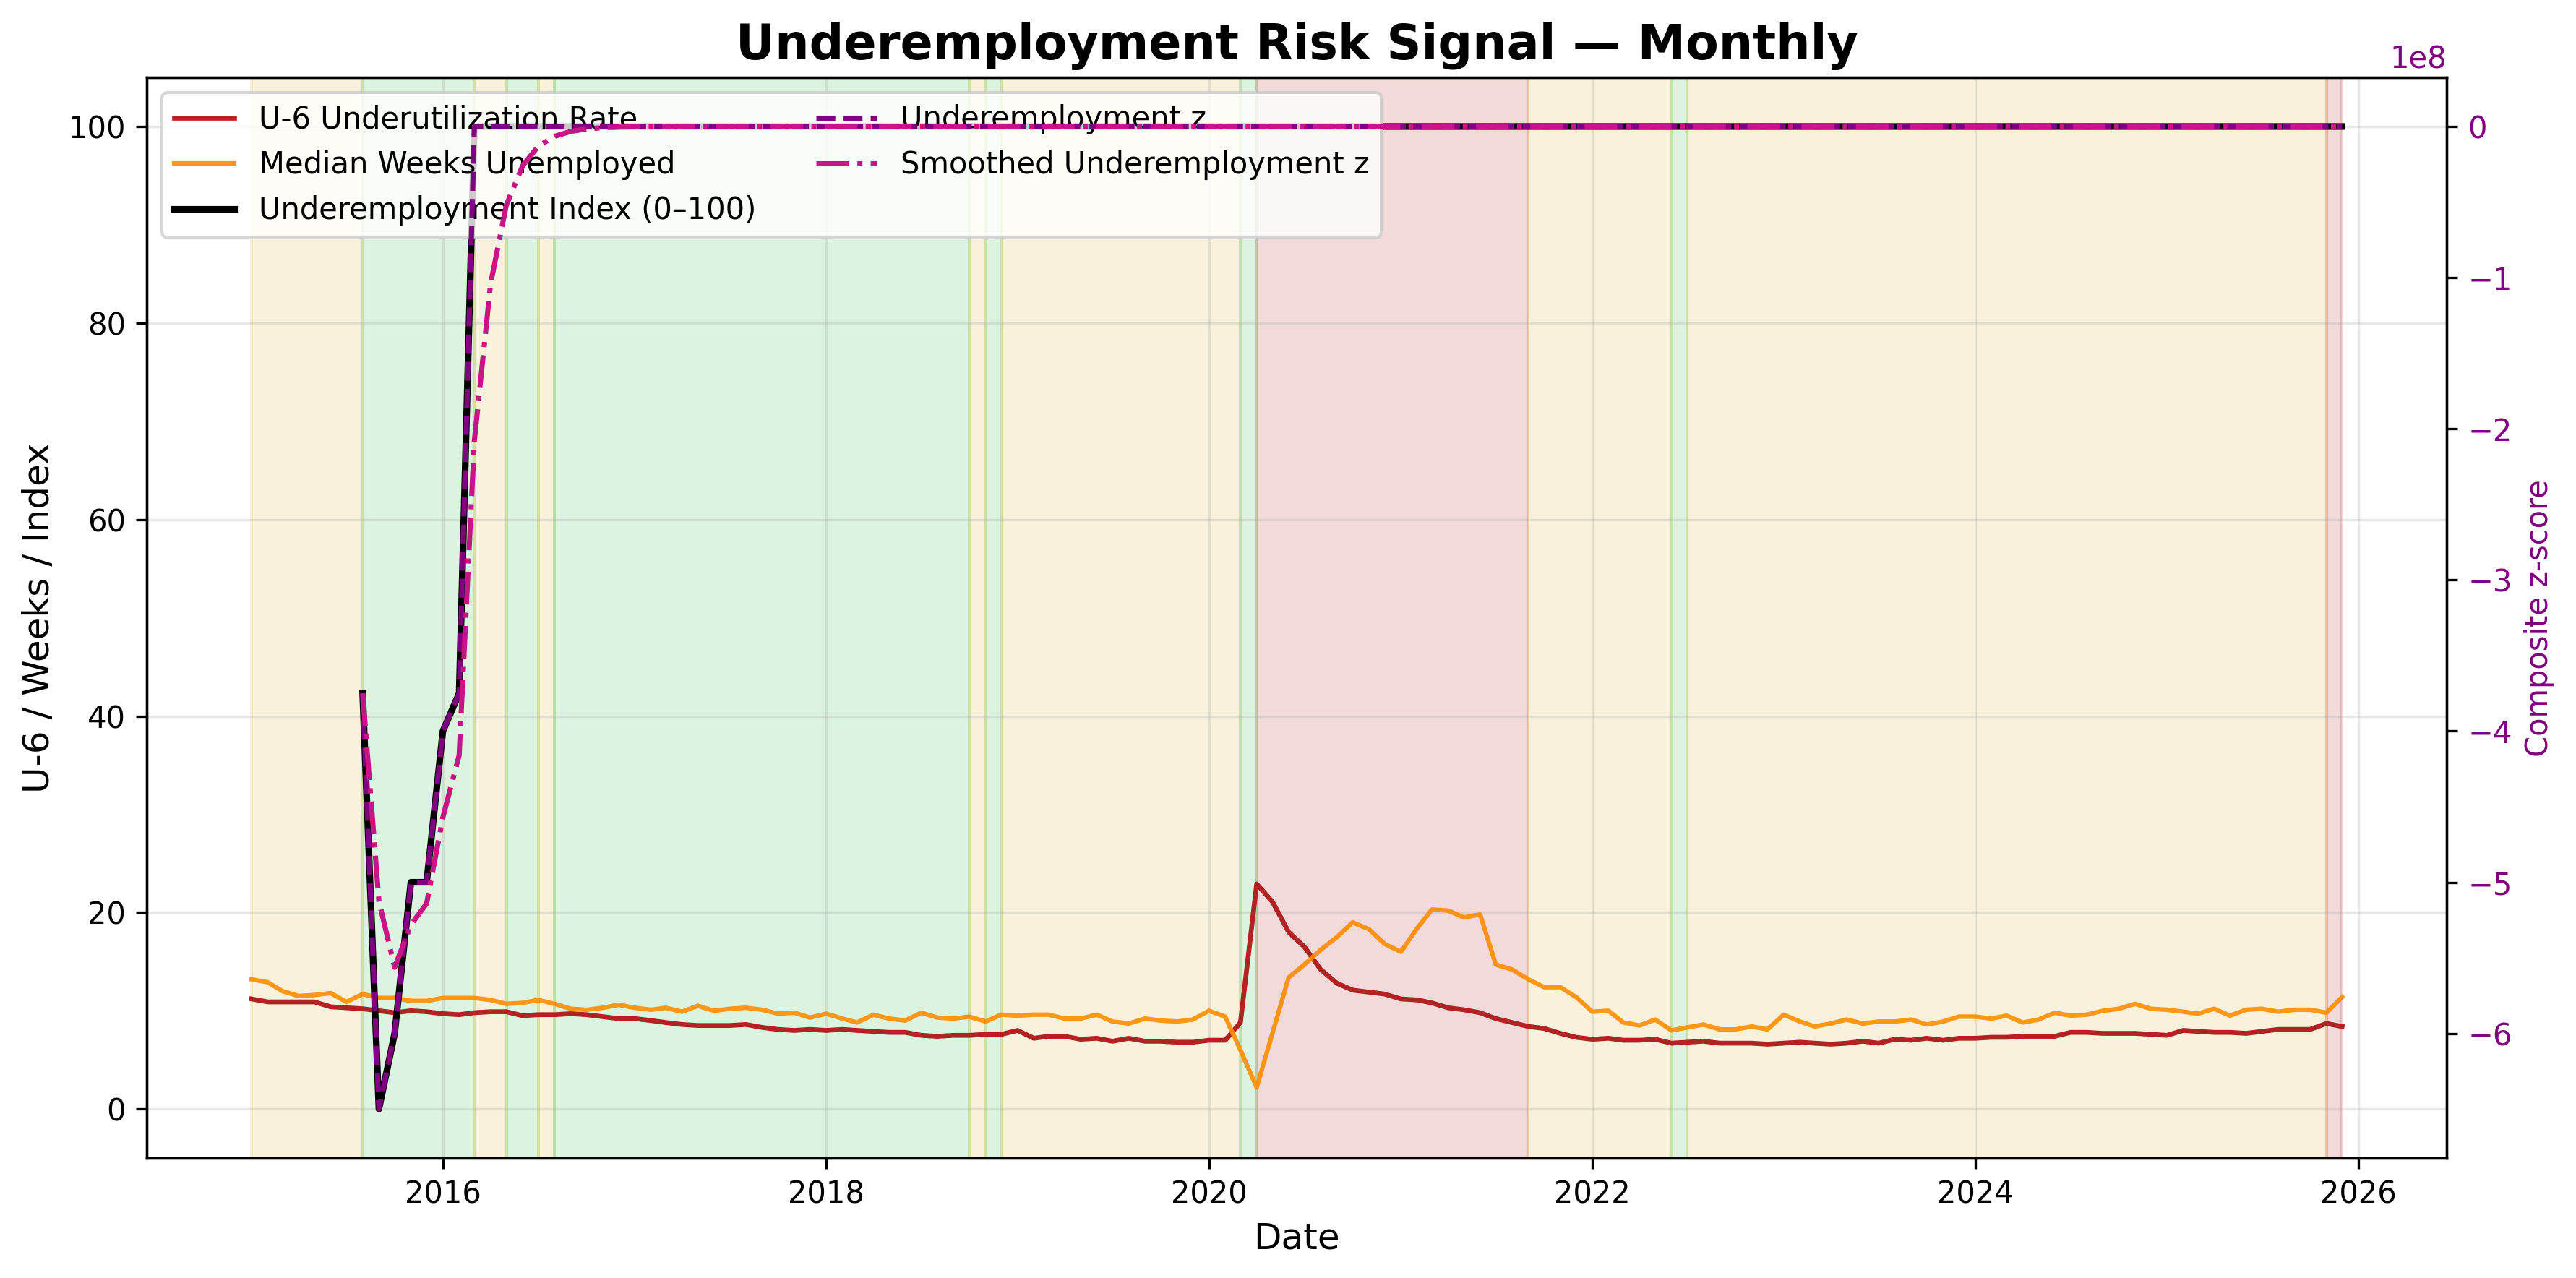
Underemployment risk: diagnostic of slack in the labour market.
Underemployment Risk Signal Table▸
The information presented is for general informational purposes only and does not constitute financial or investment advice. It has been prepared without regard to individual objectives, financial situation, or needs. You should consider whether it is appropriate for your circumstances and seek independent advice where necessary.