Investor Anatomy Series
7-day Silver news signal with 30-day price-and-news chart context.
Geopolitical de-escalation and central bank leadership shifts are driving a recovery in silver as it nears key technical resistance.
Silver’s narrative is transitioning from acute risk toward regional stability and structural supply concerns. Easing tensions have fueled a multi-day rally, though the market remains focused on the impact of new monetary leadership and persistent physical constraints.
What is driving the news flow
The primary driver is easing US-Iran friction and progress toward a ceasefire, which has reduced energy-driven inflationary pressures. This allows silver to recapture momentum during a high-stakes transition at the Federal Reserve. Under new chair Kevin Warsh, shifting rate expectations create a mixed but upwardly biased environment.
Macro & Monetary Conditions
Diplomatic progress and the potential reopening of the Strait of Hormuz may alleviate macroeconomic imbalances, potentially allowing the Fed to pivot from aggressive hikes. The outlook remains sensitive to the June 17 policy announcement, as traders seek signals on whether the new leadership will maintain a hawkish or dovish stance.
Investment & Financial Markets
Silver futures have rallied for four consecutive days, targeting the 200-day moving average. Focus has shifted from defensive hedging toward price discovery in a cooling inflation environment. While prices remain below yearly peaks, disciplined trading around technical swing levels suggests a strengthening recovery trend.
Supply & Mining
A structural deficit and misunderstood stockpile drawdowns provide a robust fundamental floor. This is reinforced by strong exploration results in districts like Argentina. These supply-side constraints suggest long-term value resilience regardless of short-term volatility in futures or geopolitical sentiment.
What to watch next
The June 19 peace deal signing will serve as a major indicator for regional stability and energy costs. Simultaneously, the first Fed rate decision under new leadership will determine if the rally sustains or fades under hawkish pressure. Key technical levels at 4,500 and 4,300, alongside global stockpile drawdowns, remain the primary metrics to monitor.
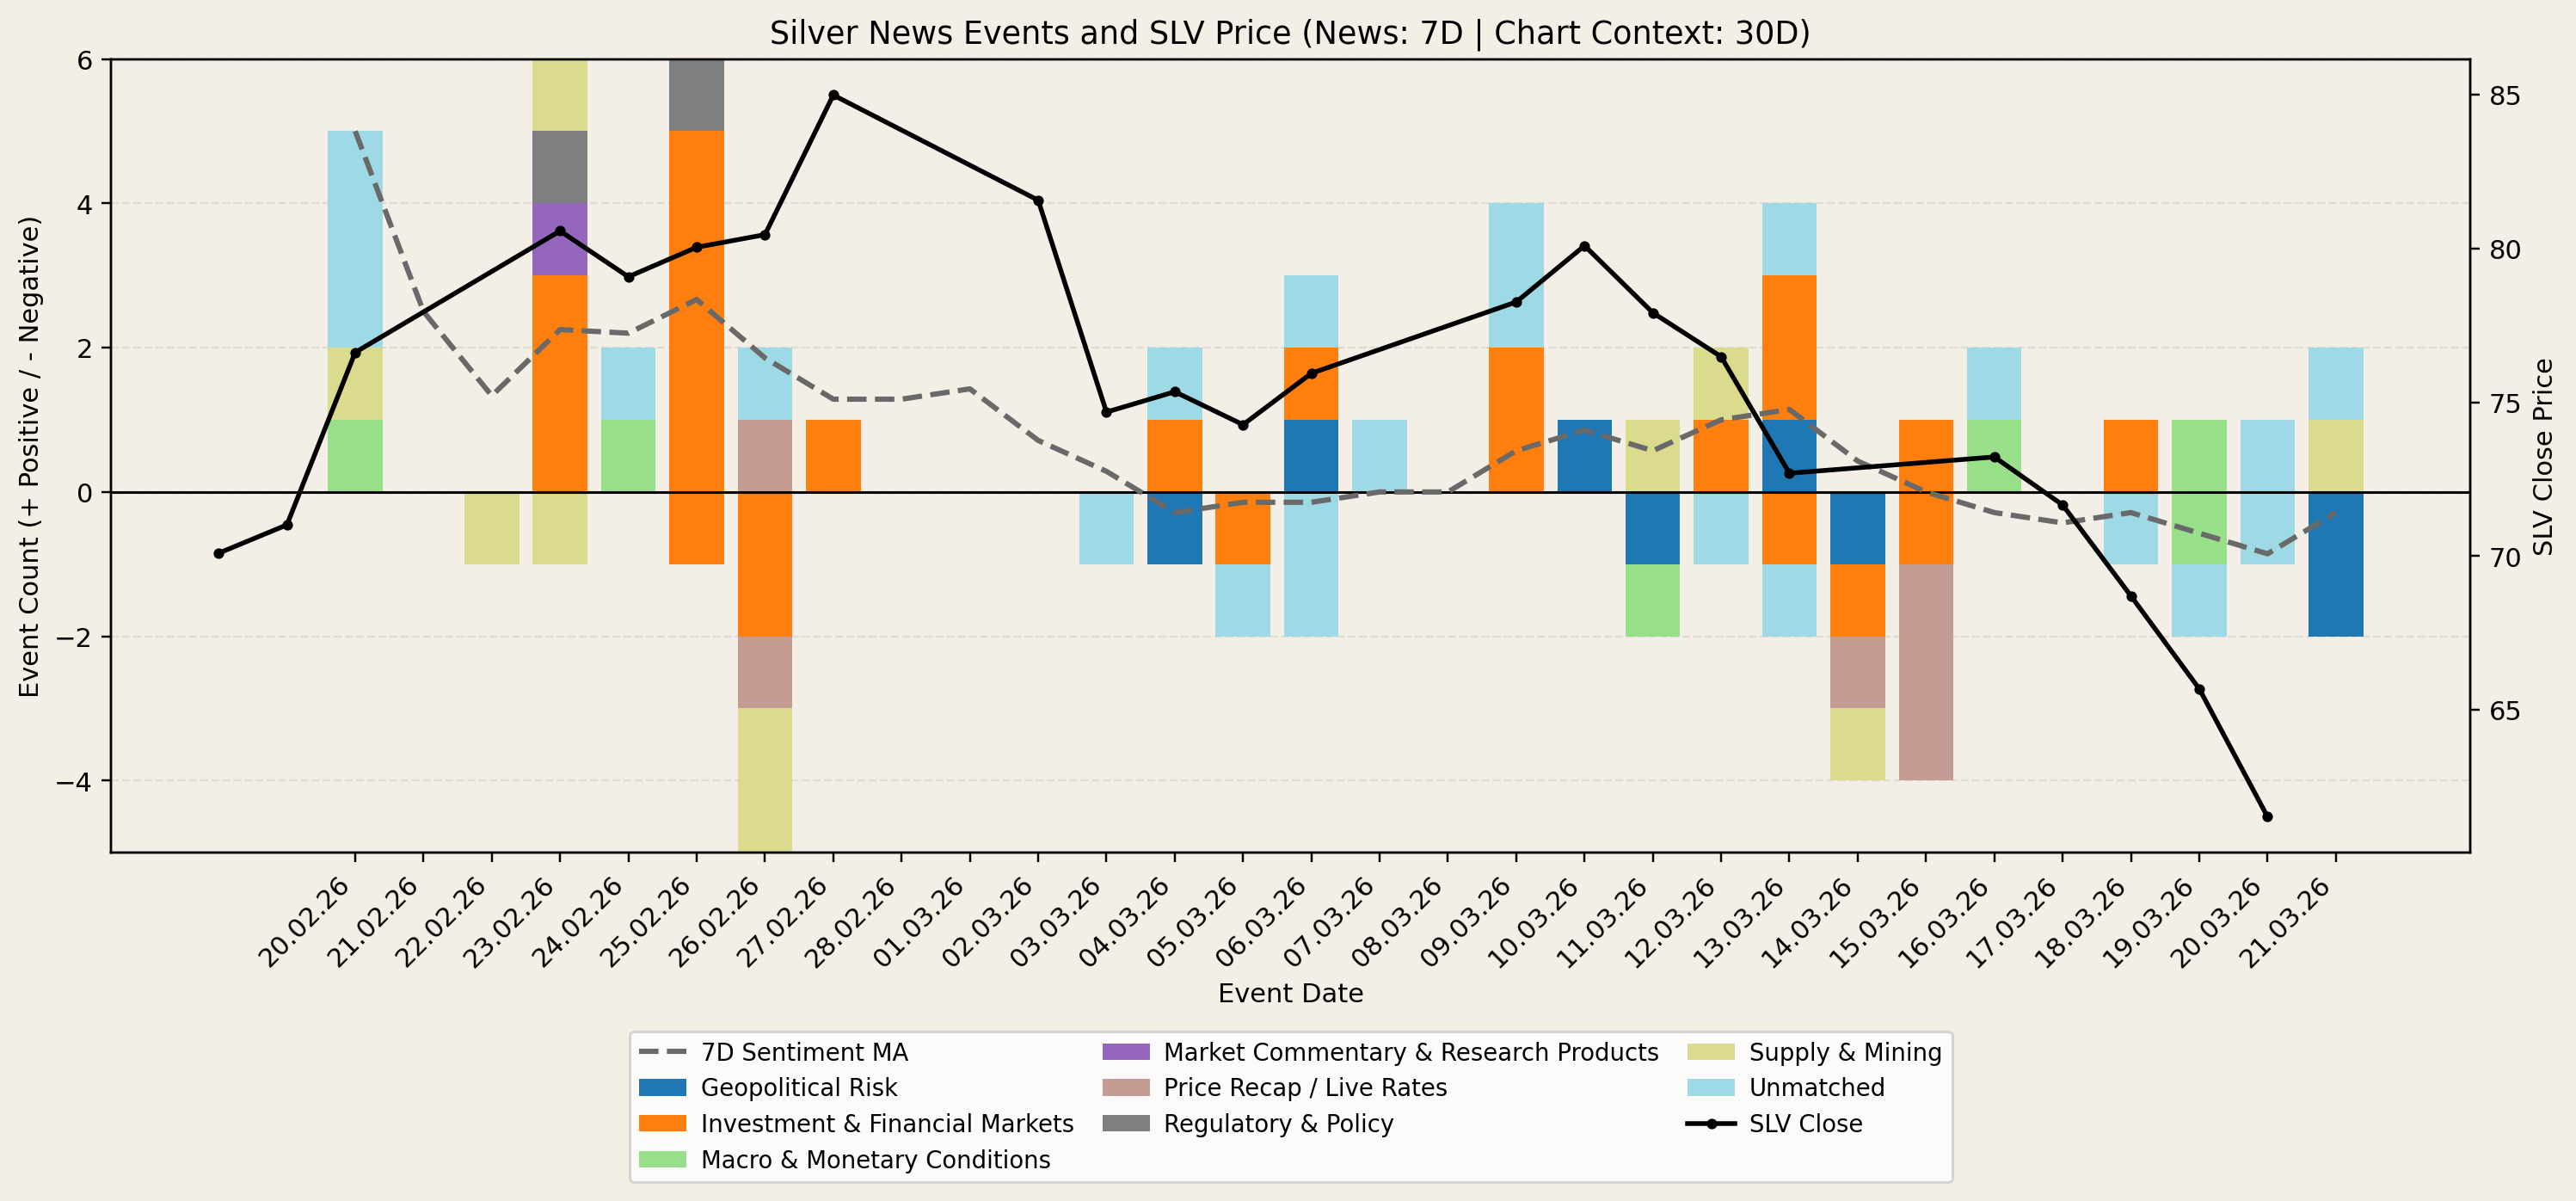
Silver News-Flow Context Chart
This chart shows daily positive and negative silver news-event counts by primary category, with SLV closing price overlaid to show how narrative intensity and direction tracked price action across the last 30 days. The written briefing above remains focused on the most recent 7-day news window.
All views expressed are personal, based on publicly available information, and do not represent the views of any employer or reflect any proprietary or internal analysis. This information should not be relied upon for making investment decisions.
No representation or warranty is made as to the accuracy, completeness, or timeliness of the information, and no liability is accepted for any loss arising directly or indirectly from its use.