GOLD - Individual Market Analysis
CoT signals and diagnostics for Gold futures.
Gemini Summary
Signal Summary:
- Configuration statement (mandatory): Given a Hedger Z-score of 2.35 and a positive 4-week positioning flow of 1.25, this setup aligns with Upward-biased price paths and Normal volatility, where the dominant risk is Mean reversion, not Trend continuation.
- The signal is currently in a Spec_Trend_Long regime with a "High_Tension_Low_Flags" synthetic state characterized by extreme hedger pressure (1).
- Conviction Band: Medium; Interpretation Confidence: High Confidence; Internal Conflict Flag: No. Signal Stability Assessment: Improving; Threshold Proximity: Near; Revision Sensitivity: Low.
Methodology Applied:
- A Hedger Z-score exceeding 2.0 identifies a fragility regime with elevated tail-risk, currently manifested as Hedgers_Deep_Long (1).
- The Speculator net positioning of 24.8% against a negative Hedger net position reflects the normal structural baseline for the gold market (1).
- Bullish divergence is identified when price decreases while positioning flow remains positive, signaling bottoming risk (1)(2).
- GOLD - COMMODITY EXCHANGE INC. data, latest observation March 17, 2026.
Key Dynamics:
- The primary driver is the extreme Hedger Z-score (2.35), which triggers the "Deep Long" pressure regime despite neutral speculative stretch (1).
- A bullish divergence has formed as the 4-week flow (1.25) remains positive while the price corrected from 5229.70 to 5001.00 (2).
- Positioning tension is rising (2.95 score), reflecting a disconnect between structural hedger support and recent price softening.
- Conditional Invalidation: A 4-week flow reversal into negative territory (Long Reduction) combined with a break in price support.
- Signal stability is improving as the 4-week flow has stabilized following a period of long reduction in early 2026.
Scenario Balance:
- Base Case dominant: Upward bias supported by extreme hedger pressure and positive flow divergence.
- Upside risk: A non-linear move higher triggered by a short-covering cascade or sudden macro risk-off stress.
- Downside risk: A regime shift toward disinflation triggered by rising real yields, leading to a "Spec_Long_Unwind" transition.
Time Horizon & Aggregation:
- Tactical (weeks): Driven by 4-week flow momentum and near-term positioning shifts.
- Aggregation Weight Hint: Medium; extreme hedger positioning serves as a significant fragility overlay for macro aggregation.
Macro Relevance:
- This signal informs the liquidity and demand dimensions of the gold market.
- The implied economic mechanism is physical or structural demand support (hedger pressure) counteracting recent speculative de-risking.
- Cycle position: Not determined.
- Typically interacts with real yields and USD regime signals to confirm if positioning fragility leads to a price reversal.
Regime Context:
- The current Spec_Trend_Long regime has persisted through March 2026, transitioning from a brief "Spec_Long_Unwind" phase in February.
- Direction of change: Stabilising after a period of weakening speculative conviction.
Model Limitations:
- Positioning extremes can persist indefinitely under stable macro regimes and do not provide deterministic timing.
- Futures data excludes large OTC and physical market participants.
Data & References:
- GOLD - COMMODITY EXCHANGE INC. (March 17, 2026) (1).
- Influential datapoints: Hedger Z-score (2.35) and 4-week Flow (1.25).
- Public datasets: 10-Year TIPS Real Yields and the USD Index (DXY) would improve interpretation confidence.
Gold CoT Diagnostics Chart
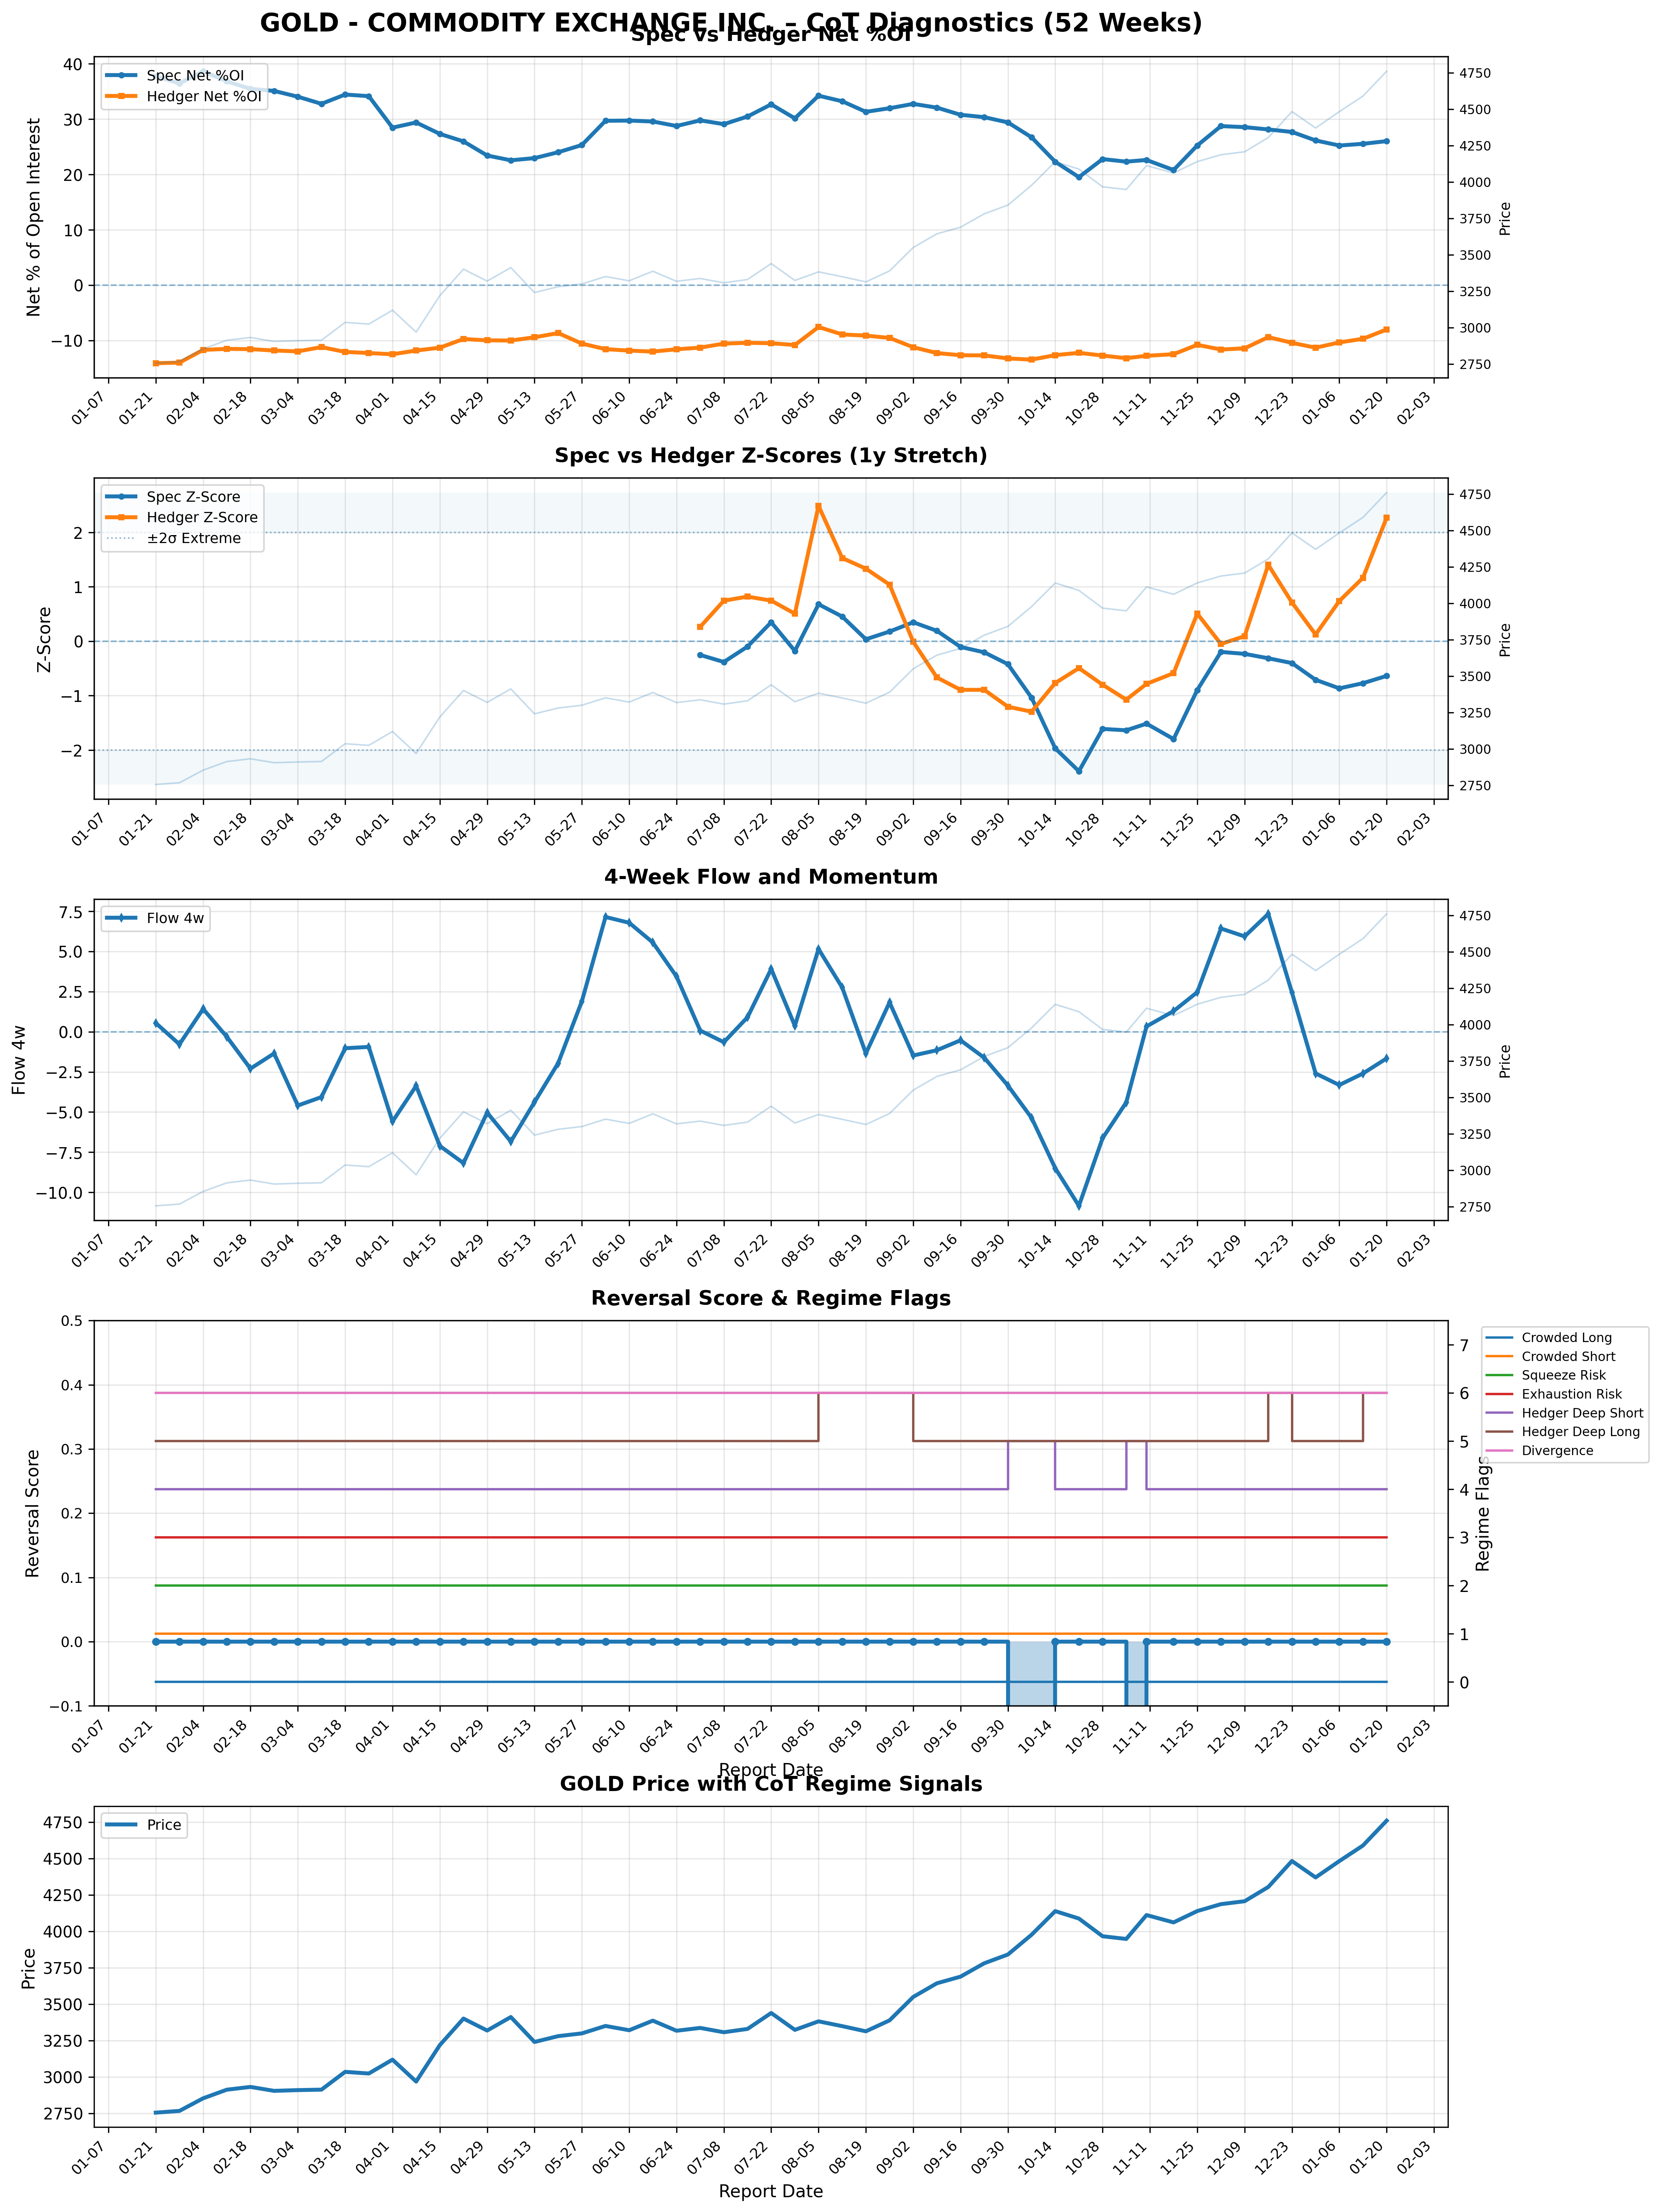
Gold futures: CoT diagnostics, positioning, crowding, reversal risk, and price overlay.
Gold CoT Signals Table▸
The information presented is for general informational purposes only and does not constitute financial or investment advice. It has been prepared without regard to individual objectives, financial situation, or needs. You should consider whether it is appropriate for your circumstances and seek independent advice where necessary.