Credit Conditions Signal
Credit conditions composite: HY/BBB spreads and equity volatility.
Gemini Summary
Signal Summary:
- Configuration statement: Given the divergence between elevated equity volatility (Z_VIX: 1.58) and near-neutral corporate spreads (Z_HY: 0.11, Z_BBB: -0.08), this setup aligns with range-biased price paths and normal volatility, where the dominant risk is a regime shift toward tightening (1).
- The signal is currently in a Neutral regime (0.216), reflecting a neutral funding environment with range-bound systemic stress (1).
- Conviction Band: Low; Interpretation Confidence: Mixed Signals; Internal Conflict Flag: Yes. Signal Stability Assessment: Deteriorating; Threshold Proximity: Moderate; Revision Sensitivity: Moderate.
Methodology Applied:
- Index values between -0.75 and 0.75 define a Neutral funding environment where stress remains range-bound (1).
- Rising values indicate a transition toward risk-off sentiment and credit contraction (1).
- The signal is decomposed into component z-scores to distinguish sentiment-driven stress (VIX) from funding-driven stress (OAS) (1).
- Credit Conditions Signal (Latest observation: 2026-03-31) (1).
Key Dynamics:
- The primary driver of the recent index rise is the VIX surge to 24.06, creating a sentiment-driven drag on the composite (1).
- Internal Tension: Corporate spreads (HY and BBB) remain stable and low, suggesting that actual funding markets are not yet pricing the risk seen in equities (1).
- Conditional Invalidation: An Index reading above 0.75 would confirm a regime shift to "Tightening" (1).
- Stability: The signal is deteriorating as the index has risen from -0.336 to 0.216 over the last three months (1).
Scenario Balance:
- Base case dominant: Funding conditions remain neutral, supported by compressed corporate spreads.
- Most plausible upside risk: Mean reversion of the VIX, returning the signal toward an Easing bias.
- Most plausible downside risk: Credit spreads widen to align with equity volatility, triggering a shift to credit contraction.
Time Horizon & Aggregation:
- Time Horizon: Tactical (weeks); the signal utilizes high-frequency VIX and weekly OAS data to capture rapid shifts in risk premia (1).
- Aggregation Weight Hint: Medium; the signal provides essential confirmation for risk-asset exposure but currently faces internal divergence.
Macro Relevance:
- Informs the US Credit Conditions dimension by quantifying systemic stress and funding availability (1).
- Economic Mechanism: High readings imply higher financing costs and a contraction in credit supply as risk premia elevate (1).
- Cycle position: Not determined.
- Typical interaction: High VIX-led readings should be validated by broader volatility and sentiment signals (1).
Regime Context:
- The signal is in a persistent Neutral regime but is currently weakening as it transitions away from the prior Easing state (1).
- Direction of change: Weakening (rising toward the tightening threshold).
Model Limitations:
- EMA(3) smoothing introduces lag in identifying rapid stress inflections (1).
- VIX component includes equity-specific variance that may not represent broad credit market stress (1).
Data & References:
- HY_OAS (3.27), BBB_OAS (1.13), and VIX (24.06) as of 2026-03-31 (1).
- Revision window cannot be assessed from provided content.
- Depth would be improved by incorporating Federal Reserve Senior Loan Officer Opinion Survey (SLOOS) data and banking liquidity spreads.
Credit Conditions Chart
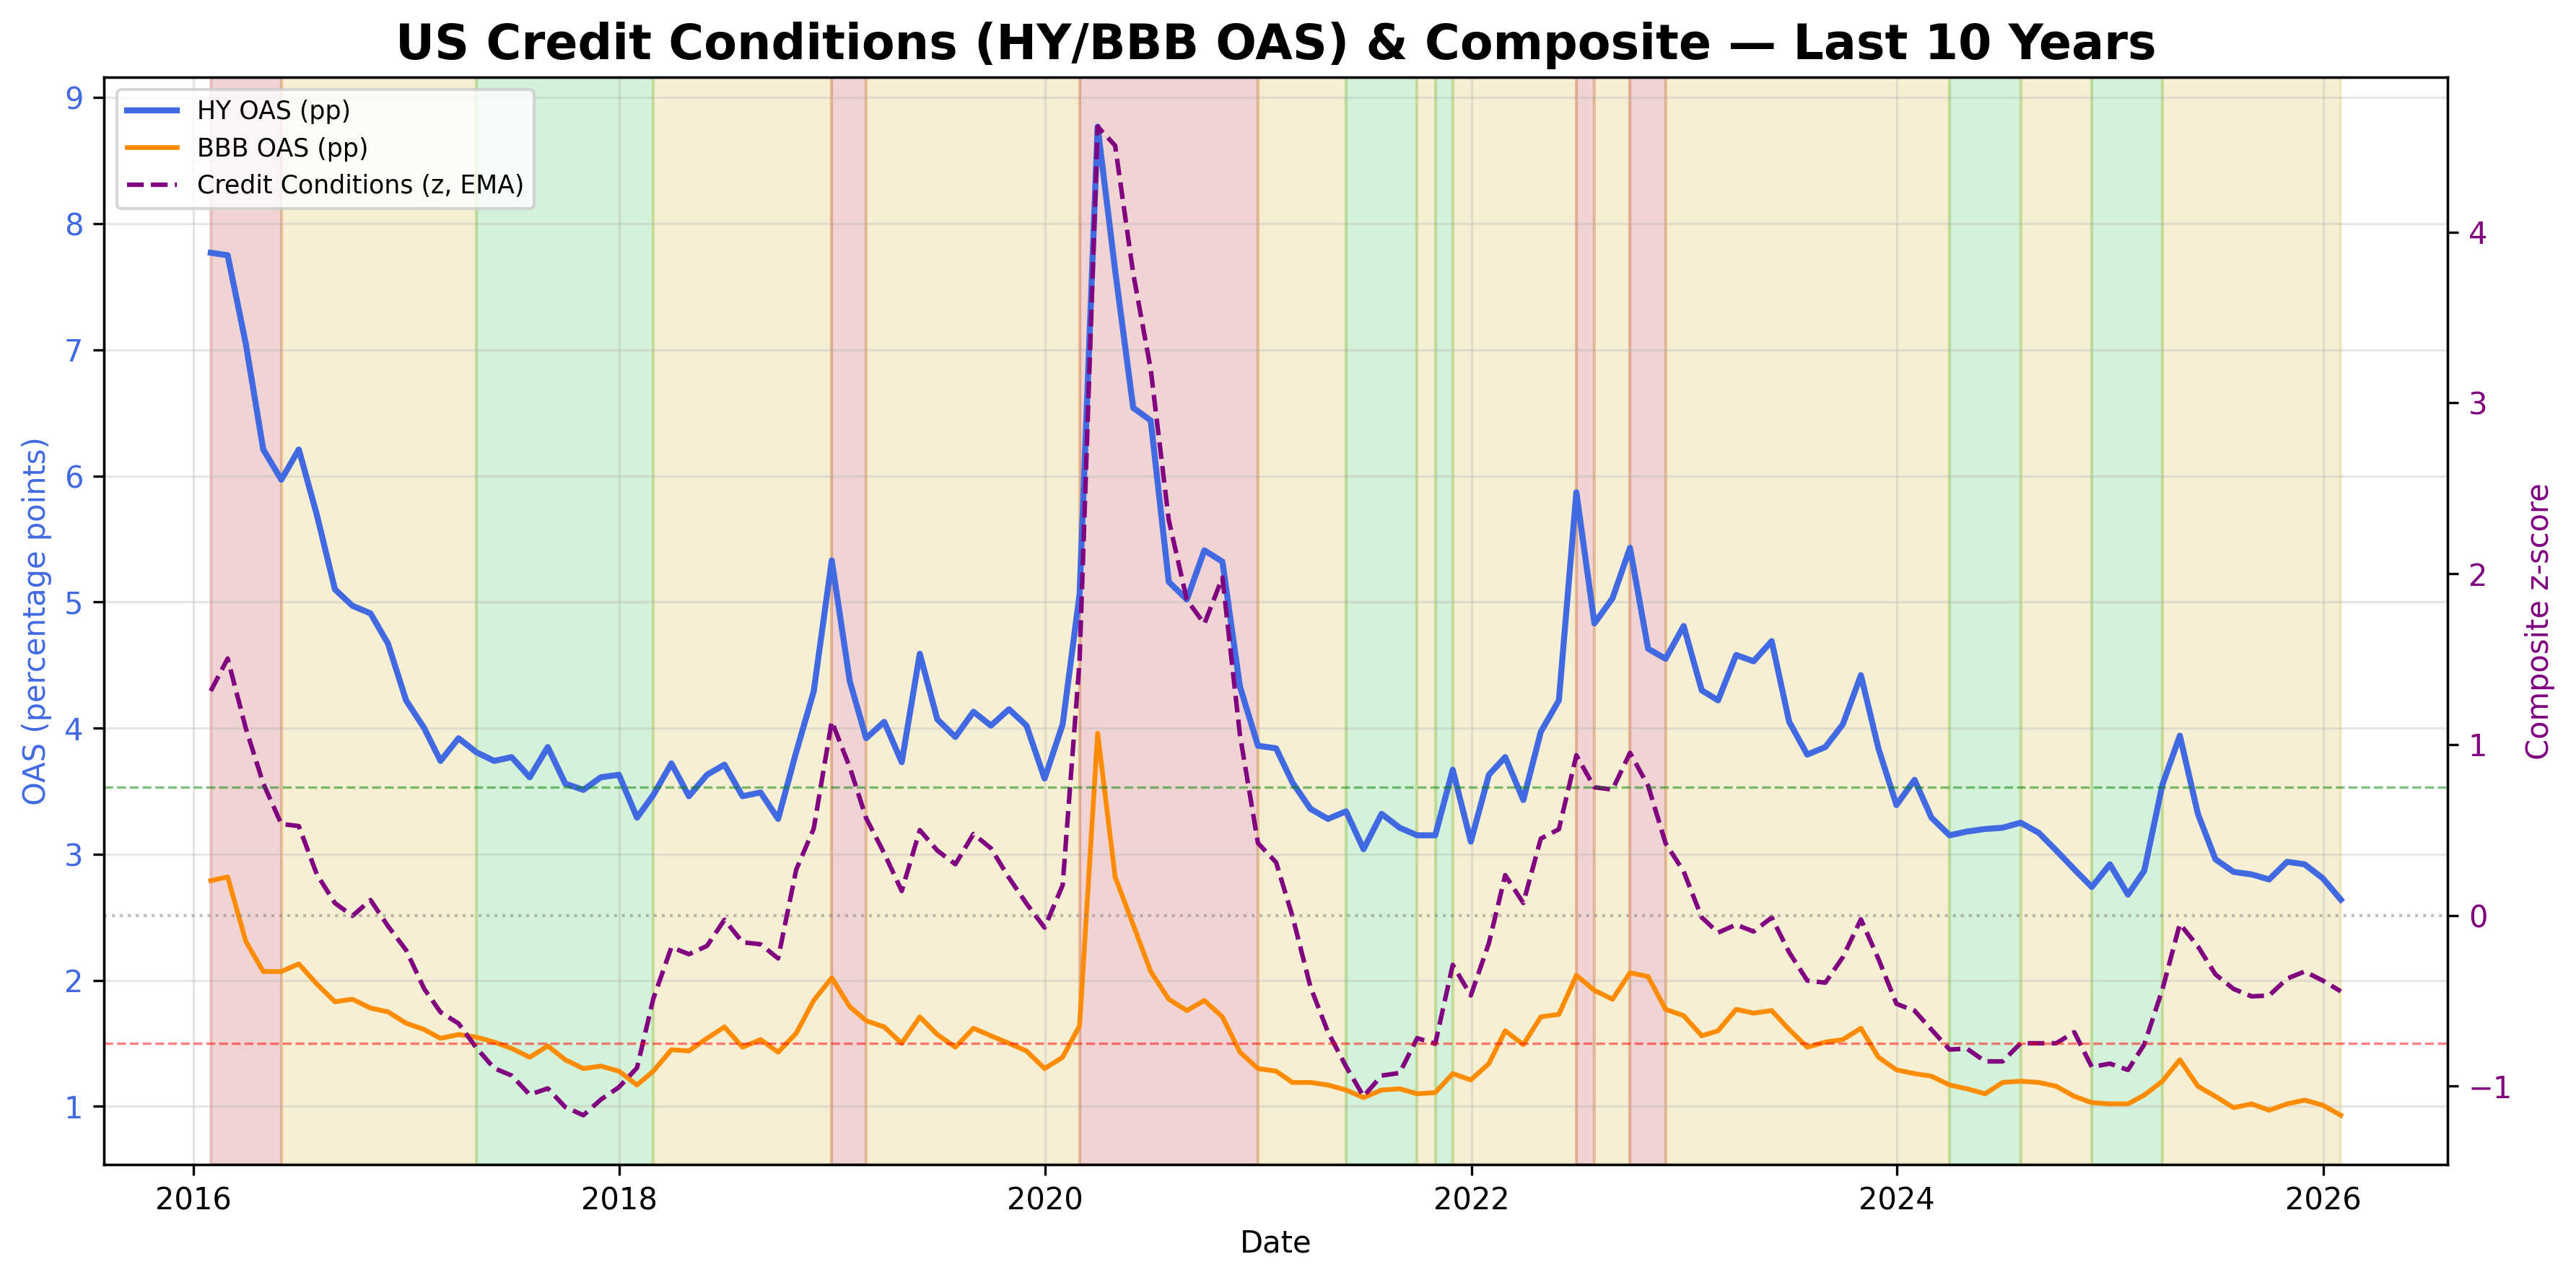
Credit spreads and volatility combined into a single financial conditions index.
Credit Conditions Table▸
The information presented is for general informational purposes only and does not constitute financial or investment advice. It has been prepared without regard to individual objectives, financial situation, or needs. You should consider whether it is appropriate for your circumstances and seek independent advice where necessary.